3 Improving Measurement
The current level of psychological evidence for digital technology use decreasing adolescent well-being is far removed from the certainty voiced by many commentators. There is little clear-cut evidence that ‘screen time’ decreases adolescent well-being, with most psychological results based on single-country, exploratory studies that rely on inaccurate but popular self-report measures of digital technology use. This chapter, encompassing three nationally representative large-scale datasets from Ireland, the United States and the United Kingdom (ntot = 17,247 after data exclusions) and including improved time-use diary measures of digital technology use, uses both exploratory and confirmatory study designs to introduce methodological and analytical improvements to a growing psychological research area. I find little evidence for substantial negative associations between digital technology use – measured either throughout the day or particularly before bedtime – and adolescent well-being.
3.1 Introduction
As digital technologies are an increasingly integral part of daily life for many, concerns about their use have become common (Bell, Bishop, and Przybylski 2015). Yet there is still little consensus as to whether and, if so, how digital technology use affects psychological well-being; results of studies have been mixed and inconclusive, with associations – when found – often being small (Etchells et al. 2016; Orben and Przybylski 2019b; Parkes et al. 2013; Przybylski and Weinstein 2017; Smith, Ferguson, and Beaver 2018).
Most previous work, including the thesis’ other two data chapters, considers the amount of time spent using digital devices or certain technological platforms, as the primary determinant of positive or negative technology effects (Neuman 1988; Przybylski and Weinstein 2017). It is therefore imperative that this work incorporates high quality assessments of such ‘screen time’. Yet, with the vast majority of studies relying on retrospective self-report scales, research indicates that there is good reason to believe this is not the case (Robinson 1985; Scharkow 2016). On the one hand, people are not skilled at perceiving the time they spend engaging in specific activities (Grondin 2010). On the other hand, there are also a myriad of additional reasons why people fail to give accurate retrospective self-report judgements (Boase and Ling 2013; Schwarz and Oyserman 2001).
Recent work has demonstrated that only one third of participants provide accurate judgements when asked about their weekly internet use, while 42% overestimate and 26% underestimate their usage time (Scharkow 2016). Inaccuracies vary systematically as a function of actual digital engagement (Vanden Abeele, Beullens, and Roe 2013; Wonneberger and Irazoqui 2017): Heavy internet users tend to underestimate the amount of time they spend online, while infrequent users over-report this behaviour (Scharkow 2016). Both these trends have been replicated in subsequent studies (Araujo et al. 2017). There are therefore substantial and endemic issues regarding the majority of current research investigating digital technology use and its effects.
Direct tracking of screen time and digital activities on the device-level is a promising approach for addressing this measurement problem (Andrews et al. 2015; David, Roberts, and Christenson 2018), yet the method comes with technical issues (Miller 2012) and is still limited to small samples (Junco 2013). Given the importance of rapidly gauging the impact of digital technology use on well-being, other approaches for measuring the phenomena that can be implemented more widely are needed for psychological science to progress.
To this end, a handful of recent studies have applied experience sampling methodology, asking participants specific technology-related questions throughout the day (Verduyn et al. 2015), or after specific bouts of digital technology use (Masur 2019). The method is complemented by studies using time-use diaries, which ask participants to recall what activities they were engaged in during pre-specified days, building a detailed picture of the participants’ daily life (Hanson et al. 2010). As most time-use diaries ask participants to recount small time windows (e.g. every 10 minutes), they facilitate the summation of total time spent engaging with digital technologies and allow for investigation into the time of day that these activities occur. Time-use diaries could therefore extend and complement more commonly used self-report measurement methodology. Yet work using these promising time-use diary measures has focused mainly on single smaller datasets, was not pre-registered, and has not examined psychological well-being as a consequence of digital technology use.
Specifically, the use of time-use diaries allows us to examine how digital technology use before bedtime affects both sleep quality and duration. Researchers have postulated that, by promoting continued availability and fears of missing out, social media platforms can decrease the amount of time adolescents sleep (Scott, Biello, and Cleland 2018). Previous research found negative effects when adolescents engage with digital technologies 30 minutes (Levenson et al. 2017), one hour (Harbard et al. 2016) and two hours (Orzech et al. 2016) before bedtime. This could be due to delayed bedtimes (Cain and Gradisar 2010; Orzech et al. 2016) or difficulties in relaxing after engaging in stimulating technology use (Harbard et al. 2016).
3.1.1 Present Research
In this chapter, I focus on the relations between digital technology use and psychological well-being using both time-use diaries and retrospective self-report data obtained from adolescents of three different countries: Ireland, the United States and the United Kingdom. Across all datasets my aim is to determine the direction, magnitude, and statistical significance of relations between adolescent digital technology use and psychological well-being, with a particular focus on the effects of digital technology use before bedtime. In order to clarify the mixed literature and provide high generalizability and transparency, the research uses the first two studies to extend a general research question concerning the link between digital technology use and well-being into specific hypotheses, that are then tested in a third confirmatory study. More specifically, I use Specification Curve Analysis to identify promising links in my two exploratory studies, generating informed data- and theory-based hypotheses. The robustness of these hypotheses is then evaluated in a third study using a preregistered confirmatory design. Subjecting the results from the first two studies to the highest methodological standards of testing, this research aims to shed further light on whether digital technology use has reliable, measurable and substantial associations with the psychological well-being of adolescents.
3.2 Exploratory Studies
3.2.1 Methods
3.2.1.1 Datasets and Participants
Data from two nationally representative datasets collected in Ireland and the United States were used to explore the plausible links between psychological well-being and digital technology use, generating hypotheses for subsequent testing. I selected both datasets because they were large in comparison to normal social psychological research datasets (total n = 5,363; Ireland: n = 4,573, United States: n = 790 after data exclusions), nationally representative, and have harmonized well-being and time-use diary measurements. Because technology use changes so rapidly, only the most recent wave of time-use diaries was analysed so that the data reflects the current state of digital technology use.
The first dataset under analysis was Growing up in Ireland (GUI, Williams et al. 2009). In my study, I focused on the GUI child cohort that tracked 5,023 nine-year-olds, recruited via random sampling of primary schools. The wave of interest took place between August 2011 and March 2012 and includes 2,514 boys and 2,509 girls, mostly aged thirteen (4,943 thirteen-year-olds, 24 twelve-year-olds and 56 fourteen-year-olds). The time-use diaries were completed on a day individually allocated by the head office (either weekend or weekday) after the primary interview of both children and their caretakers. After data exclusions, 4,573 adolescents were included in the study.
Collected between 2014 and 2015, the second dataset of interest was the United States Panel Study of Income Dynamics (PSID, University of Michigan. Survey Research Center 2018), including 741 girls and 767 boys. It encompassed participants of a variety of different age groups: 108 eight-year-olds, 100 nine-year-olds, 110 ten-year-olds, 89 eleven-year-olds, 201 twelve-year-olds, 213 thirteen-year-olds, 190 fourteen-year-olds, 186 fifteen-year-olds, 165 sixteen-year-olds, 127 seventeen-year-olds and 19 did not provide an age. I only selected those 790 participants between the ages of twelve and fifteen, to match the age ranges in the other datasets used. The sample was collected by involving all children in households already interviewed by the PSID who descended from either the original families recruited in 1968 or the 1997 new immigrant family sample. Those participants in the child supplement that were selected to receive an in-home visit, were asked to complete two time-use diaries on randomly assigned days (one on a weekday and one on a weekend day).
3.2.1.2 Ethical Review
The Research Ethics Committee of the Health Research Board in Ireland gave ethical approval to the GUI study. The University of Michigan Health Sciences and Behavioral Sciences Institutional Review Board reviews the PSID annually to ensure its compliance to ethical standards.
3.2.1.3 Measures
This paper examines a variety of well-being and digital technology use measures. While each dataset included a range of well-being questionnaires, I only considered those measures present in at least one of the exploratory datasets (i.e. the GUI and PSID) and in the dataset used for my confirmatory study. This included the popular Strengths and Difficulties Questionnaire (SDQ) completed by caretakers (present in GUI and the confirmatory study), and two questionnaires filled out by adolescents: (1) A well-being questionnaire for each dataset, including the Short Mood and Feelings Questionnaire for the GUI and the confirmatory study and the Children’s Depression Inventory present in the PSID and (2) The Rosenberg Self-Esteem scale (present in the PSID and the confirmatory study).
3.2.1.3.1 Adolescent well-being.
The first measure of adolescent well-being considered was the SDQ completed by the Irish participants’ primary caretakers (Goodman et al. 2000). This measure of psychosocial functioning has been widely used and validated in school, home and clinical contexts (Goodman 1997). It includes 25 questions, five each about prosocial behaviour, hyperactivity or inattention, emotional symptoms, conduct problems and peer relationship problems (0 = not true, 1 = somewhat true, 2 = certainly true, scale subsequently reversed, see Table 2.1).
The second measure of adolescent well-being was an abbreviated version of the Rosenberg Self-Esteem Scale completed by US participants (Robins, Hendin, and Trzesniewski 2001). This was a five item measure that asked: “How much do you agree or disagree with the following statement?:” “On the whole, I am satisfied with myself”, “I feel like I have a number of good qualities”, “I am able to do things as well as most other people”, “I am a person of value” and “I feel good about myself”. The participants answered these questions on a four item Likert scale from strongly agree (4) to strongly disagree (1).
Third, for the Irish dataset I included the Short Mood and Feelings Questionnaire as a negative indicator of well-being. The adolescent participants answered questions about how they felt or acted in the past two weeks using a three-level Likert Scale from true (1) to not true (3). Items included “I felt miserable or unhappy”, “I didn’t enjoy anything at all”, “I felt so tired I just sat around and did nothing”, “I was very restless”, “I felt I was no good any more”, “I cried a lot”, “I found it hard to think properly or concentrate”, “I hated myself”, “I was a bad person”, “I felt lonely”, “I thought nobody really loved me”, “I thought I could never be as good as other kids” and “I did everything wrong”. I subsequently reversed item scores so that they instead measured adolescent well-being.
Finally, for the US sample, I included the Children’s Depression Inventory as a measure of adolescent well-being. The participants were asked to think about the last two weeks and select a sentence that best described their feelings (see Table 3.1). The sentences are very similar to the twelve questions about subjective affective states and general mood asked in the confirmatory dataset detailed later in the paper.
| Option 1 | Option 2 | Option 3 |
|---|---|---|
| I am sad once in a while | I am sad many times | I am sad all the time |
| Nothing will ever work out for me | I am not sure if things will work out for me | Things will work out for me |
| I do most things O.K | I do many things O.K | I do everything wrong |
| I hate myself | I do not like myself | I like myself |
| I feel like crying everyday | I feel like crying many days | I feel like crying once in a while |
| Things bother me all the time | Things bother me many times | Things bother me once in a while |
| I look O.K | There are some bad things about my looks | I look ugly |
| I do not feel alone | I feel alone many times | I feel alone all the time |
| I have plenty of friends | I have some friends, but I wish I had more | I do not have any friends |
| Nobody really loves me | I am not sure if anybody loves me | I am sure that somebody loves me |
3.2.1.3.2 Adolescent digital technology use.
The study included two varieties of digital technology use measures: Retrospective self-report measures of digital technology use, and estimates derived from time-use diaries. Details regarding these measures varied for each dataset due to differences in the questionnaires and time diaries used. For all datasets, I removed those participants who filled out a time-use diary during a weekday that was not term or school time, furthermore if the participants went to bed after midnight (after the time-use diary is concluded) I coded them as going to bed at midnight.
3.2.1.3.2.1 Retrospective reports.
The Irish dataset included three questions asking participants to think of a normal weekday during term-time and estimate: “How many hours do you spend watching television, videos or DVDs?”, “How much time do you spend using the computer (do not include time spent using computers in school)?” and “How much time do you spend playing video games such as PlayStation, X-box, Nintendo, etc.?”. Participants could answer in hours and minutes, yet this was recoded by the survey administrator into a 13-level scale. I took the mean of these measures to obtain a general digital technology use measure. In the US dataset adolescents were asked: “In the past 30 days, how often did you use a computer or other electronic device (such as a tablet or smartphone):” “For school work done at school or at home”, “For these types of online activities (visiting a newspaper or news-related website; watch or listen to music, videos, TV shoes or movies; follow topics or people that interest you on websites, blogs, or social media sites (like Facebook, Instagram or Twitter), not including following or interacting with friends or family online)”, “To play games” and “For interacting with others”. Participants answered using a five-point Likert scale ranging from every day (5) to never (1). For the US data I took the mean of these four items to obtain a general digital technology use measure.
3.2.1.3.2.2 Time-use diaries.
The study focused on five discrete measures from the participants’ self-completed time-use diaries: (1) Whether the participants reported engaging with any digital technologies, (2) How much time they spent doing so, and (3) Whether they did so two hours, (4) One hour and (5) 30 minutes before going to bed. I separated these numerical measures for weekend and weekday, resulting in a total of ten different variables.
Each time-use diary, although harmonized by study administrators, was administered and coded slightly differently. The Irish dataset contained 21 pre-coded activities that participants could select for each 15-minute period. They included the four categories I then aggregated into my digital technology use measure: “Using the internet/emailing (including social networking, browsing etc.)”, “Playing computer games (e.g. PlayStation, PSP, X-Box or Wii)”, “Talking on the phone or texting” or “watching TV, films, videos or DVDs”. In the US dataset, participants (or their caretakers) could report their activities freely, including primary and secondary activities, duration and where the activity occurred. Research assistants coded them afterwards. There were 13 codes I aggregated in my digital technology use measure including lessons in using a computer or other electronic device, playing electronic games, other technology based recreational activities, communication using technology social media, texting, uploading or creating internet content, non-specific work with technology like installing software or hardware, photographic processing and other activities involving a computer or electronic device. I aggregated these measures and do not include them in my analyses separately because there were too few people who scored on any one coded variable.
Time-use diary activity measures commonly have high positive skew: many participants do not note down the activity at all, while only a few report spending much time on the activity. It is common practice to address this by splitting the time-use variable into two measures: The first reflecting participation and the second reflecting amount of participation (i.e. the time spent doing this activity, Hammer 2012; Rohrer and Lucas 2018). Participation is a dichotomous variable representing whether a participant reported engaging in the activity on a given day, whereas time spent is a continuous variable considering the amount of technology use for those participants who reported doing the activity.
In addition to including these two different measures – for weekends and weekdays separately – I also created six measures of technology use before bedtime. These measures were dichotomous, indicating whether the participant had used technology in the specified time interval. These time intervals were 30 minutes, 1 hour and 2 hours before bed on a weekend day and weekday separately.
3.2.1.3.3 Control variables.
Minimal control variables were incorporated in these exploratory analyses to prevent spurious correlations or conditional associations complicating my hypothesis generating process: gender and age for both Irish and US datasets.
3.2.1.4 Analytic Approach
To examine the correlation between digital technology use and well-being, I use the SCA approach proposed by Simonsohn and colleagues (Simonsohn, Simmons, and Nelson 2015) and detailed in Chapter 2. SCA enables researchers to implement many possible analytical pathways and interpret them as one entity, respecting that the garden of forking paths allows for many different data analysis options which should be taken into account in scientific reporting (Gelman and Loken 2014). Because the aim for these analyses was to generate informed data- and theory-driven hypotheses, to then test in a later confirmatory study, the analyses consisted of four steps.
3.2.1.4.1 I. Correlations between retrospective reports and time-use diary estimates.
The first analytical step was to examine the correlations between retrospective self-report and time-use diary measures of digital technology use, to gauge whether they are measuring similar or removed concepts. This was done to inform later interpretations of the SCA and to give valuable insights to researchers about such widely used measures.
3.2.1.4.2 II. Identifying specifications.
I then decided which theoretically defensible specifications to include in the SCA. While this was done a priori for all studies, it was only pre-registered specifically for the confirmatory study. The three main analytical choices addressed in the SCA were: (1) How to measure well-being, (2) How to measure digital technology use and (3) Whether to include statistical controls or not (see Section 3.2.2). There were three different possible measures of well-being included in the exploratory datasets: (1) The Strengths and Difficulties Questionnaire, (2) The reversed Children’s Depression Inventory or Short Mood and Feelings Scale, and (3) The Rosenberg Self-Esteem scale. There were 11 possible measures of digital technology use, including the retrospective self-report measure and the time-use diary measures separated for weekend day or weekday (participation, time spent, technology use <2 hours, <1 hour and <30 minutes before bedtime). Lastly, there was a choice of whether to include controls in the subsequent analyses or not.
3.2.1.4.3 III. Implementing Specifications.
Taking each specification in turn, I ran a linear regression to obtain the standardized regression coefficient () linking digital technology use measurements to well-being outcomes. To do so, I first used the various digital technology use measures to predict the specific well-being questionnaires identified in the study. The regression either included control variables or not, depending on the specification. I noted the resulting standardized regression coefficient, the corresponding p value and the partial . I also ran 500 bootstrapped models of each SCA to obtain the 95% confidence intervals around the standardized regression coefficient and the effect size measure.
The specifications were then ranked by their regression coefficient and plotted in a specification curve, where the spread of the associations is most clearly visualized. The bottom panel of the specification curve plot illustrates what analytical decisions lead to what results, creating a tool for mapping out the, too often invisible, garden of forking paths (for example, see Figure 3.1).
3.2.1.4.4 IV. Statistical Inferences.
Bootstrapped models were implemented to examine whether the associations evident in the calculated specifications were significant (Orben and Przybylski 2019b; Simonsohn, Simmons, and Nelson 2015). I was particularly interested in the different measures and time of digital technology use, so ran a separate significance test for each technology use measure. My bootstrapped approach was necessary, because the specifications do not meet the independency assumption of conventional statistical testing. Like in Chapter 2, I created datasets where I knew the null hypothesis was true and examined the median and number of significant specifications in the dominant direction (the sign of the majority of the specifications) they produced. I used these two significance measures as proposed by Simonsohn and colleagues, but do not report the number of specifications in the dominant direction – a significance measure also proposed by the authors and used in Chapter 2 – as the nature of the data meant these tests did not give an accurate overview of the data (they can be found in the Appendix, Table B.1-B.4). It was possible to calculate whether the amount of significant specifications or median s found in the original dataset were ‘surprising’, that is whether less than 5% of the null-hypothesis datasets had more significant specifications in the dominant direction or more extreme median s than the original dataset.
To create the datasets where the null-hypothesis was true, I extracted the standardised regression coefficient of interest (), multiplied it by the technology use measure and subtracted it from the well-being measure. I then used these values as my dependent well-being variable, in a dataset where I now know the effect not to be present. I then ran 500 bootstrapped SCAs using this data. As the bootstrapping operation was repeated 500 times, it was possible to examine whether each bootstrapped dataset (where the null hypothesis was known to be true) had more significant specifications or more extreme median s than the original dataset. To obtain the p value of the bootstrapping test, I divided the number of bootstraps with more significant specifications in the dominant direction or more extreme median s than the original dataset by the overall number of bootstraps.
3.2.2 Results
3.2.2.1 I. Correlations Between Retrospective Reports and Time-Use Diary Estimates
For Irish adolescents, the correlation of measures relating to digital technology use, operationalized using the time-use diary estimate (prior to dichotomization into participation and time spent) and retrospective self-report measurement, was small ( = 0.18). For American adolescents, the correlations relating time-use diary measures on a weekday ( = 0.08) and weekend day ( = 0.05) to self-report digital technology use measurements were small as well.
3.2.2.2 II. Identifying Specifications
I identified 44 specifications each for the Irish and US datasets.
- Irish dataset
– Operationalizing adolescent well-being: Strength and Difficulties Questionnaire; Short Mood and Feelings Questionnaire (Well-being)
– Operationalizing digital technology use: Retrospective self-report measure; Time-use diary measures (weekday and weekend separately: participation, time spent, < 2 hours before bedtime, < 1 hour before bedtime, < 30 minutes before bedtime)
– Which control variables to include: Either include control variables or not
- American dataset
– Operationalizing adolescent well-being: Children’s Depression Inventory (Well-being); Rosenberg Self-Esteem Scale
– Operationalizing digital technology use: Retrospective self-report measure; Time-use diary measures (weekday and weekend separately: participation, time spent, < 2 hours before bedtime, < 1 hour before bedtime, < 30 minutes before bedtime)
– Which control variables to include: Either include control variables or not
3.2.2.3 III. Implementing Specifications
After all analytical pathways specified in the previous step were implemented, it was evident that there were significant specifications present in both datasets (Figure 3.1, left and middle panel). Some specifications showed significant negative associations ( = 16), though there was a larger proportion of non-significant specifications present ( = 72). No statistically significant specifications were positive. Specifications using retrospective self-report digital technology use measures resulted in the largest negative associations in the Irish data. I did not find this trend in the US data, possibly due to the restricted range of response anchors connected to their self-report digital technology use measures.
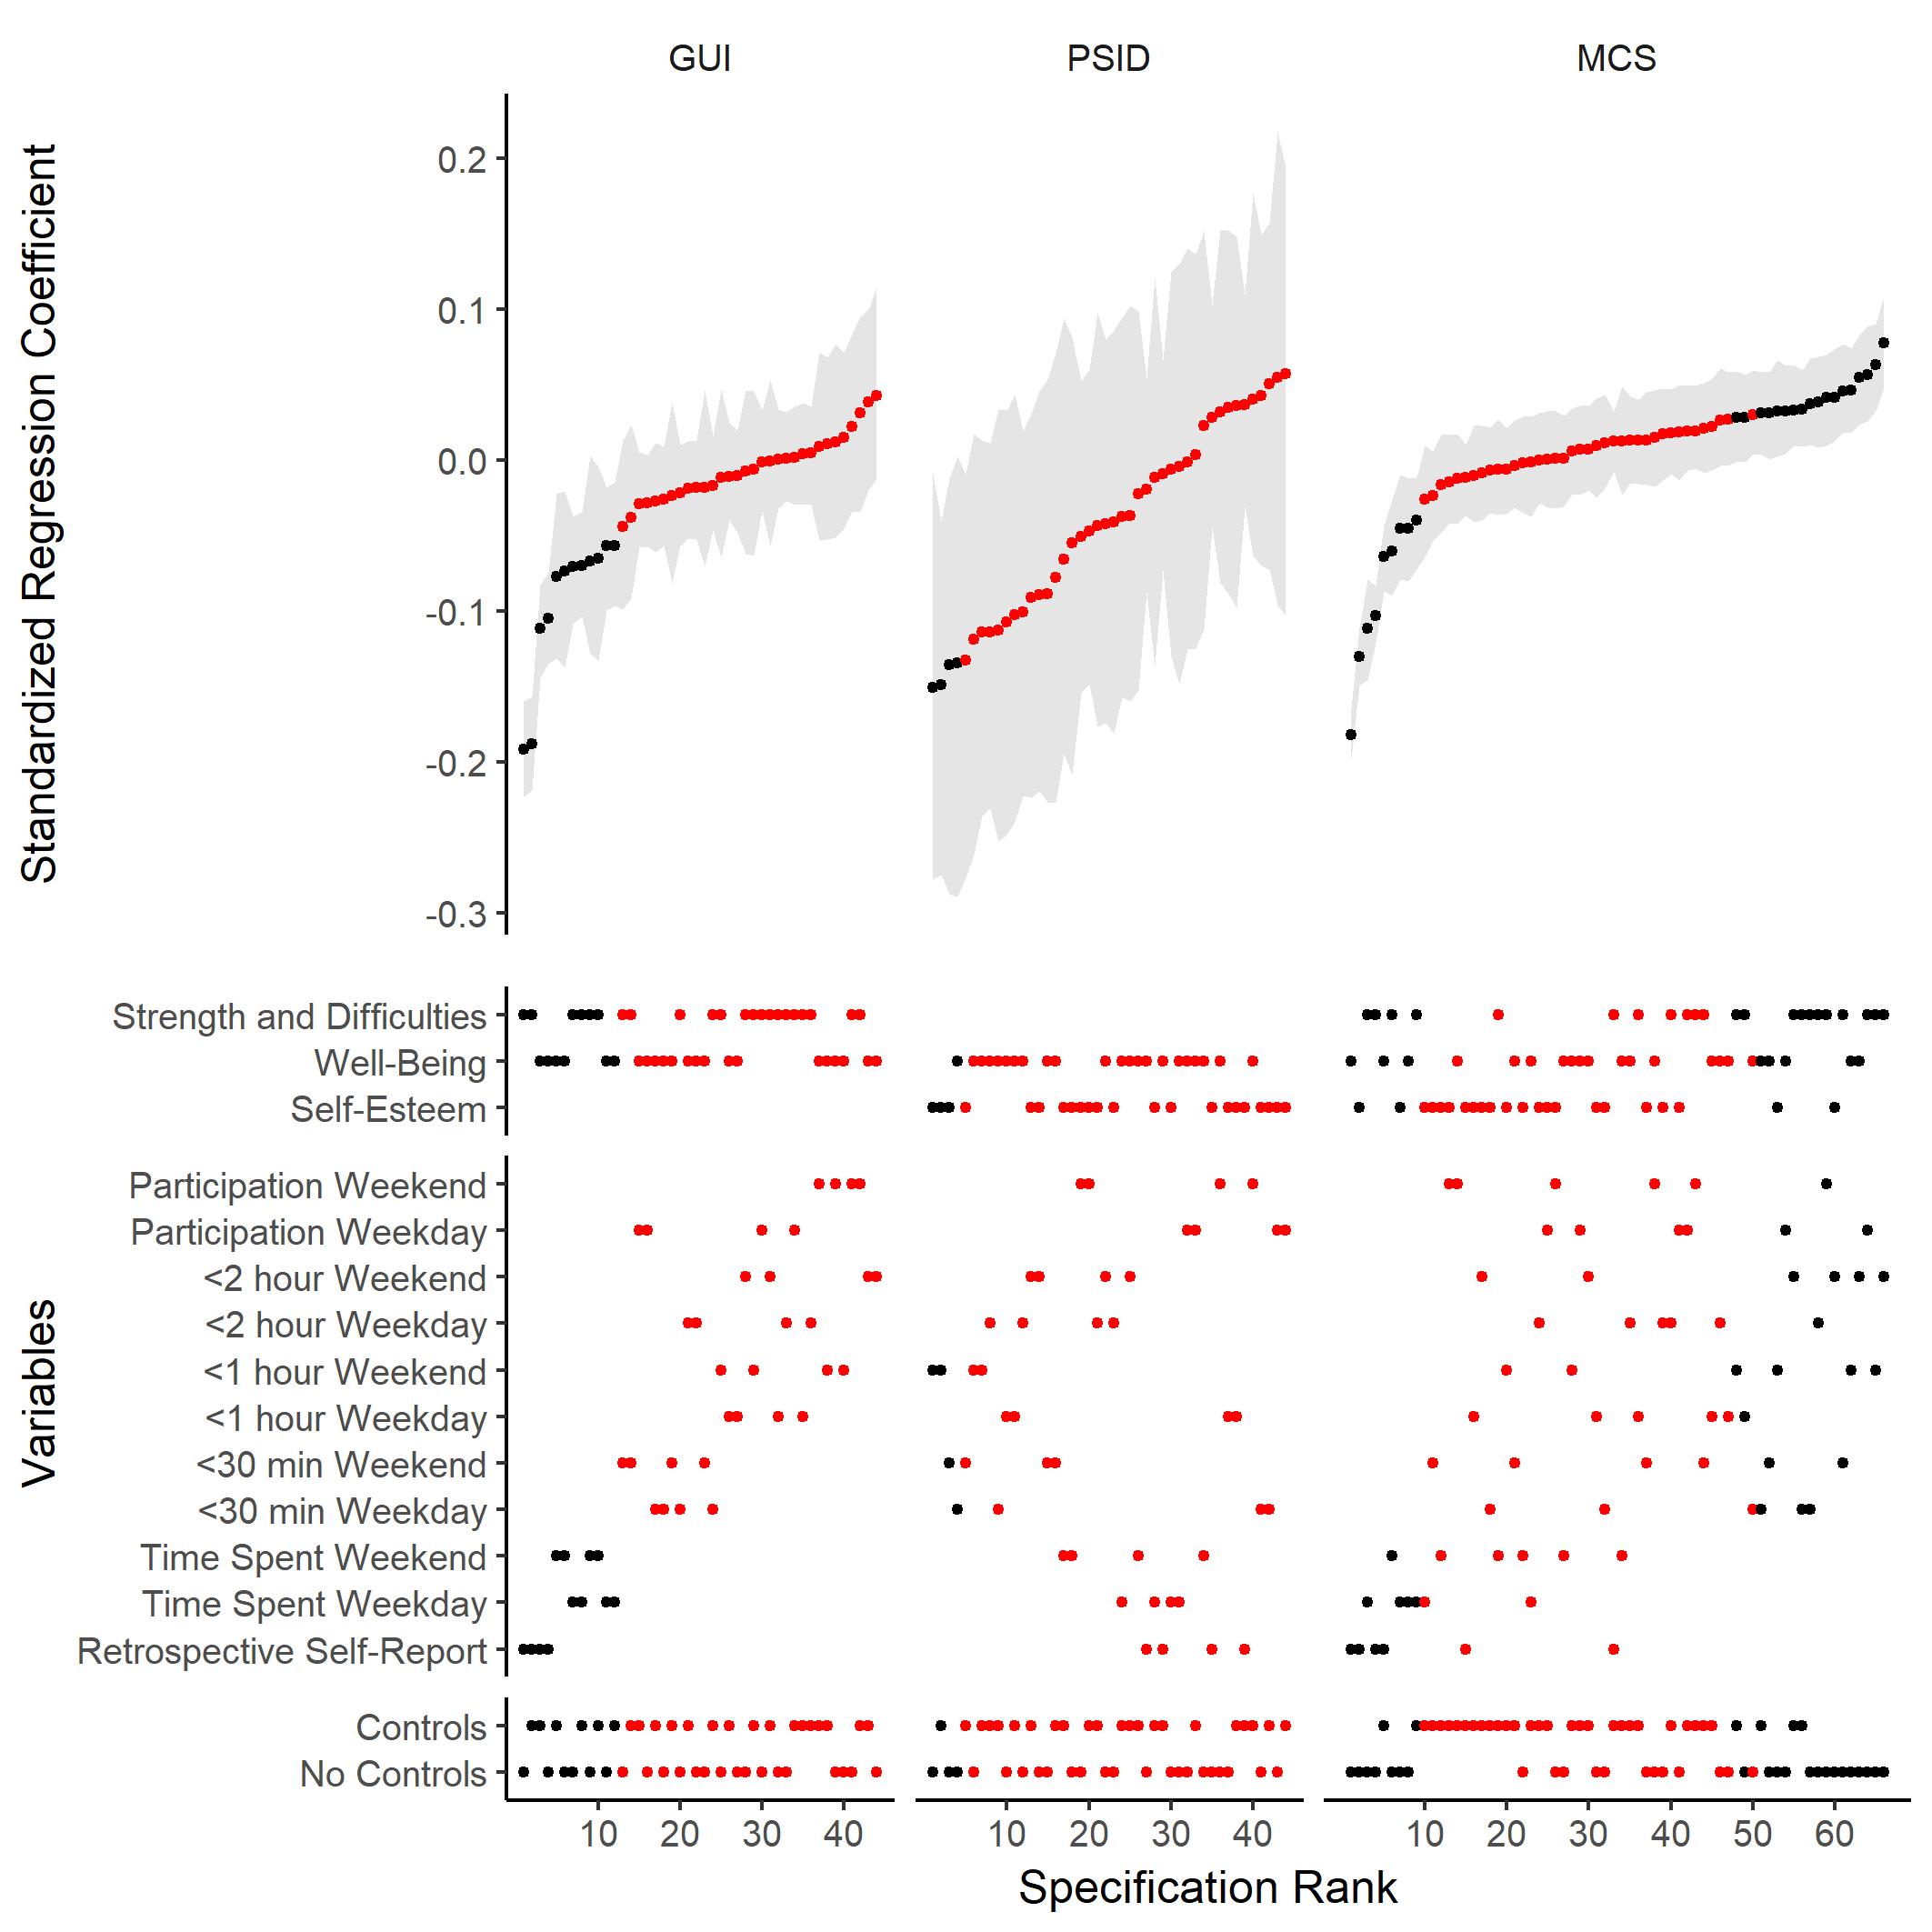
Figure 3.1: Results of the Specification Curve Analysis of Irish, American and British datasets for the correlation between well-being and digital technology use. Grey areas denote 95% confidence intervals of regression coefficients obtained using bootstrapping. Note specifications marked in red were not statistically significant ( > 0.05) whereas those in black were ( < 0.05)
3.2.2.4 IV. Statistical Inferences
Using bootstrapped null models, I found significant correlations between digital technology use and psychological well-being in both the Irish and American datasets (Table 3.2 and 3.3). I count those correlations as significant that find significant effects both for the median and number of significant tests in the dominant direction.
There was a significant correlation between retrospective self-report digital technology use (median = -.15, p < .001; number of sig. results in dominant direction (# sig results) = 4/4, p < .001) and adolescent well-being in the Irish dataset. There were also negative associations for some of the time-use diary measures: Notably time spent using digital technologies on a weekday (median = -.07, p < .001; # sig result = 4/4, p < .001) and on a weekend (median = -.06, p < .001; # sig result = 4/4, p < .001). In the American dataset I found significant associations only for digital technology use 1 hour before bedtime on a weekend day (median = -.13, p < .001; # sig result = 2/4, p = .001). There were no significant associations of retrospective self-reported digital technology use. Taking this pattern of results as a whole, I derived a series of promising data- and theory-driven hypotheses to test in a confirmatory study.
| Technology Measure | beta | p value | number | p value |
|---|---|---|---|---|
| Participation: Weekend | 0.02 (-0.02, 0.05) | 0.31 | 0 | 1.00 |
| Participation: Weekday | -0.01 (-0.03, 0.01) | 0.16 | 0 | 1.00 |
| <2 hours: Weekend | 0.02 (-0.02, 0.02) | 0.27 | 0 | 1.00 |
| <2 hours: Weekday | -0.01 (-0.02, 0.01) | 0.39 | 0 | 1.00 |
| <1 hour: Weekend | 0.00 (-0.01, 0.05) | 0.91 | 0 | 1.00 |
| <1 hour: Weekday | 0.00 (-0.04, 0.00) | 0.65 | 0 | 1.00 |
| <30 minutes: Weekend | -0.03 (-0.06, 0.00) | 0.05 | 0 | 1.00 |
| <30 minutes: Weekday | -0.02 (-0.03, 0.04) | 0.01 | 0 | 1.00 |
| Time spent: Weekend | -0.07* (-0.10, -0.04) | 0.00* | 4* | 0.00* |
| Time spent: Weekday | -0.06* (-0.08, -0.04) | 0.00* | 4* | 0.00* |
| Self-report | -0.15* (-0.17, -0.13) | 0.00* | 4* | 0.00* |
| Technology Measure | beta | p value | number | p value |
|---|---|---|---|---|
| Participation: Weekend | -0.01 (-0.07, 0.05) | 0.47 | 0 | 1.00 |
| Participation: Weekday | 0.03 (-0.05, 0.10) | 0.32 | 0 | 1.00 |
| <2 hours: Weekend | -0.07 (-0.11, 0.05) | 0.04 | 0 | 1.00 |
| <2 hours: Weekday | -0.07 (-0.14, 0.00) | 0.08 | 0 | 1.00 |
| <1 hour: Weekend | -0.13* (-0.15, 0.00) | 0.00* | 2* | 0.01* |
| <1 hour: Weekday | -0.03 (-0.12, 0.04) | 0.77 | 0 | 1.00 |
| <30 minutes: Weekend | -0.11 (-0.18, -0.03) | 0.00 | 1 | 0.30 |
| <30 minutes: Weekday | -0.03 (-0.20, -0.06) | 0.81 | 1 | 0.20 |
| Time spent: Weekend | -0.04 (-0.11, 0.05) | 0.24 | 0 | 1.00 |
| Time spent: Weekday | -0.01 (-0.09, 0.05) | 0.74 | 0 | 1.00 |
| Self-report | 0.01 (-0.03, 0.05) | 0.40 | 0 | 1.00 |
3.3 Confirmatory Study
From the two exploratory studies detailed above, and from previous literature about the negative effects of technology use during the week on well-being (Harbard et al. 2016; Levenson et al. 2017; Owens 2014), I derived five specific hypotheses concerning digital technology use and psychological well-being. My aim was to evaluate the robustness of these hypotheses in a third representative adolescent cohort. To this end, I pre-registered my data analysis plan on the Open Science Framework (http://dx.doi.org/10.17605/OSF.IO/WRH4X), focusing on the data collected as part of the Millennium Cohort Study (University of London 2017), prior to the date that the data were made available to researchers. My hypotheses were fivefold:
H1: Higher retrospective reports of digital technology use would correlate with lower observed levels of adolescent well-being
H2: Total time spent engaging with digital technologies, derived from time-use diary measures, would correlate with lower observed levels of adolescent well-being
H3: Digital technology use 30 minutes before bedtime on weekdays, derived from time-use diary measures, would correlate with lower observed levels of adolescent well-being
H4: Digital technology use 1 hour before bedtime on weekdays, derived from time-use diary measures, would correlate with lower observed levels of adolescent well-being
H5: In models without controls (detailed below) the negative association will be more pronounced (i.e. will have a larger absolute value) than in models with controls
3.3.1 Methods
3.3.1.1 Datasets and Participants
The focus of the confirmatory analyses was the longitudinal Millennium Cohort Study (MCS), which followed a UK cohort of young people born between September 2000 and January 2001 (University of London 2017). The survey of interest was administered in 2015 and included responses by 11,884 adolescents and their caregivers. It encompassed 5,931 girls and 5,953 boys: 2,864 thirteen-year-olds, 8,860 fourteen-year-olds and 160 fifteen-year-olds. Using clustered stratified sampling, it oversampled minorities and participants living in disadvantaged areas. Each adolescent completed two (one weekend day and one weekday), paper, web-based or app-based time-use diaries, within ten days of the main interviewer visit.
3.3.1.2 Ethical Review
The UK National Health Service (NHS) London, Northern, Yorkshire and South-West Research Ethics Committees gave ethical approval for data collection.
3.3.1.3 Measures
3.3.1.3.1 Adolescent well-being.
In addition to the Strengths and Difficulties questionnaire completed by the caretaker, the Rosenberg Self-Esteem scale was used, as was an abbreviated version of the short form Mood and Feelings Questionnaire (Angold et al. 1995). This measure instructed participants: “For each question please select the answer which reflects how you have been feeling or acting in the past two weeks:”, “I felt miserable or unhappy”, “I didn’t enjoy anything at all”, “I felt so tired I just sat around and did nothing_”, “I was very restless”, “I felt I was no good any more”, “I cried a lot”, “I found it hard to think properly or concentrate”, “I hated myself”, “I was a bad person”, “I felt lonely”, “I thought nobody really loved me”, “I thought I could never be as good as other kids” and “I did everything wrong” (1 = “not true,” 2 = “sometimes,” 3 = “true,” scale subsequently reversed).
3.3.1.3.2 Adolescent technology use.
Like the US and Irish datasets, the UK dataset included a retrospective self-report digital technology use items. The mean of the four questions concerned with hours per weekday the adolescent spent “watching television programmes or films”, “playing electronic games on a computer or games systems”, “using the internet” at home and “on social networking or messaging sites or Apps on the internet” (1 = “none” to 8 = “7 hours or more”) was taken.
Using the time-use diary data, digital technology use measures were derived in line with the approach used for the exploratory datasets. Participants could select certain activity codes for each 10-minute time slot (except in the app-based time diary where there were 1-minute slots): Five of these activity codes were used in the aggregate measure of digital technology use: “answering emails, instant messaging, texting”, “browsing and updating social networking sites”, “general internet browsing, programming”, “playing electronic games and Apps” and “watching TV, DVDs, downloaded videos”.
3.3.1.3.3 Control variables.
The control variables detailed in the analysis plan were chosen using previous studies as a template (Orben and Przybylski 2019b; Parkes et al. 2013). In both these studies and in the present analysis, a range of sociodemographic factors and maternal characteristics, including the child’s sex and age, mother’s education, ethnicity, psychological distress (K6 Kessler Scale) and employment were included as control variables. These factors also included household-level variables like household income, number of siblings present, whether the father was present, closeness to parents, the time the primary caretaker could spend with the children. Finally, there were adolescent-level variables that included reports of long-term illness and negative attitudes towards school. To control for the caretaker’s current cognitive ability, I also included the primary caretaker’s score on a word activity task where they were presented with a list of target words and needed to choose synonyms from a corresponding list.
3.3.1.4 Analytic Approach
In broad strokes, the confirmatory analytical pathway followed the approach used to examine the exploratory datasets. I included bootstrapped models of all variables, like in my exploratory analyses, but also extended these to examine the specific pre-registered hypotheses. I adapted my pre-registered analysis plan to run simple regressions instead of structural equation models to allow me to implement my significance testing analyses. Furthermore, after submitting my pre-registration I decided to analyse bootstrapped SCAs to obtain confidence intervals and to run two-sided hypothesis tests, rather than one-sided tests, as they are more informative for the reader.
In the pre-registration I also specified a Smallest Effect Size of Interest (SESOI, Lakens, Scheel, and Isager 2018), a concept proposed to avoid the problematic over-interpretation of significant but minimal associations, which are becoming increasingly common in large-scale studies of technology use outcomes (Ferguson 2009; Orben and Przybylski 2019b). In line with Ferguson, a correlation coefficient SESOI of r = .10 (95% CI .099 to .101) was pre-registered. In other words, digital technology use associations that explained less than 1% (i.e. < 0.01) of well-being outcomes were judged, a priori, as being too modest in practical terms to be worthy of extended scientific discussion.
3.3.2 Results
3.3.2.1 I. Correlations Between Retrospective Reports and Time-Use Diary Estimates
The correlation between self-report digital technology use and time-use diary measures of digital technology use was in line with the Irish data ( = .18 for both weekdays and weekend days). This was higher and more consistent than what was observed in the US data, as the retrospective self-report response options in the British and Irish data were of better quality.
3.3.2.2 II. Identifying Specifications
I identified 66 specifications for the UK dataset (22 more than for Irish or US data) because there were three different measures of psychological well-being, 11 digital technology use measures and the decision whether to include control variables or not.
- Operationalizing adolescent well-being: Strength and Difficulties Questionnaire; Short Mood and Feelings Questionnaire (Well-being), Rosenberg Self-Esteem Scale
- Operationalizing digital technology use: Retrospective self-report measure; Time-use diary measures (weekday and weekend separately: participation, time spent, < 2 hours before bedtime, < 1 hour before bedtime, < 30 minutes before bedtime)
- Which control variables to include: Either include control variables or not
3.3.2.3 III. Implementing Specifications
The specification results are plotted in the right panel of Figure 3.1. In contrast to the exploratory analyses, both significant positive and negative associations between digital technology use and well-being were in evidence. As was the case for the exploratory data, retrospective self-report measures consistently showed the most negative correlations. Digital technology use before bedtime measures showed significant positive associations ( = 18) while not showing any negative associations.
3.3.2.4 IV. Statistical Inferences
Mirroring the approach used to analyse the exploratory datasets (see Table 3.4), I found that there was a significant negative correlation between retrospective self-report digital technology use and adolescent well-being (median = -.08, p < .001; # sig result = 4/6, p < .001). There was also a negative association of time spent engaging with digital technologies on a weekday (median = -.04, p < .001; # sig result = 4/6, p < .001). There were, however, significant positive associations for other time-use diary measures of digital technology use, including participation with digital technologies on a weekday (median = .02 p = .010; # sig result = 2/6, p = .020), digital technology use 30 minutes before bedtime on a weekday (median = .03, p < .001; # sig result = 3/6, p < .001) and weekend day (median = .02, p = .010; # sig result = 2/6, p = .010), digital technology use 1 hour before bedtime on a weekend (median = .03, p < .001; # sig result = 4/6, p < .001) and digital technology use 2 hours before bedtime on a weekend (median = .04, p < .001; # sig result = 4/6, p < .001).
| Technology Measure | beta | p value | number | p value |
|---|---|---|---|---|
| Participation: Weekend | 0.01 (-0.01, 0.02) | 0.28 | 1 | 0.32 |
| Participation: Weekday | 0.02* (0.00, 0.04) | 0.01* | 2* | 0.02* |
| <2 hours: Weekend | 0.04* (0.00, 0.03) | 0.00* | 4* | 0.00* |
| <2 hours: Weekday | 0.02 (0.00, 0.03) | 0.01 | 1 | 0.27 |
| <1 hour: Weekend | 0.03* (0.02, 0.05) | 0.00* | 4* | 0.00* |
| <1 hour: Weekday | 0.02 (0.01, 0.04) | 0.02 | 1 | 0.27 |
| <30 minutes: Weekend | 0.02* (0.00, 0.03) | 0.01* | 2* | 0.01* |
| <30 minutes: Weekday | 0.03* (0.02, 0.50) | 0.00* | 3* | 0.00* |
| Time spent: Weekend | 0.00 (-0.02, 0.01) | 0.66 | 1 | 0.25 |
| Time spent: Weekday | -0.04* (-0.06, -0.02) | 0.00* | 4* | 0.00* |
| Self-report | -0.08* (-0.10, -0.07) | 0.00* | 4* | 0.00* |
3.3.2.4.1 Hypothesis 1: Retrospective self-reported digital technology use and psychological well-being.
Because I find that retrospective self-report digital technology use significantly decreases adolescent well-being (median = -.08 [-.10, -.07], p < .001; # sig result = 4/6, p < .001), using a two-sided bootstrapped test, my first hypothesis is supported (see Table 3.5). The median partial value (partial = .008 [.006, .011]) is below my Smallest Effect Size of Interest (SESOI; i.e., r = -.10) detailed in the preregistered analysis plan. It must, however, be noted that the 95% confidence interval extends above the SESOI.
3.3.2.4.2 Hypothesis 2: Time spent engaging with digital technologies and psychological well-being.
I examined general time spent engaging with digital technologies, both on a weekend and weekday, using time-use diary measures and one-sided bootstrapped tests. A significant negative association (median = -.02 [-.04, -.01], p < .001; # sig result = 5/12, p < .001) was in evidence. The direction and significance of this correlation was in line with the registered hypothesis, yet this association was also smaller than the prespecified SESOI (partial = .001 [.000, .002]). Again, the 95% confidence interval of the effect size falls above the SESOI.
3.3.2.4.3 Hypothesis 3: Technology use 30 min before bedtime on a weekday and psychological well-being.
Results focusing on digital technology use 30 minutes before bed, using a two-sided bootstrapped test, indicated that this hypothesis was not confirmed (median = .03 [.01, .05], p < .001; # sig result = 3/6, p < .001), as the effect was in the opposite direction.
3.3.2.4.4 Hypothesis 4: Technology use 1 hour before bedtime on a weekday and psychological well-being.
Models examining the association of digital technology use 1 hour before bedtime on a weekday found no effect in the hypothesized negative direction (median = .02 [.01, .04], p = .02; # sig result = 1/6, p = .27), therefore not supporting the fourth hypothesis.
3.3.2.4.5 Hypothesis 5: Comparing models that do and do not account for confounding variables when testing the relation between digital technology use and psychological well-being.
Lastly, the effect of including controls in my confirmatory models was evaluated. Figure 3.2 presents two different specification curves, one including and one excluding controls. Visual inspection of the models shows that those with controls exhibit less extreme negative associations. This is supported by the difference in the median associations (controls r = .026, no controls r = .001). A one-sided paired t-test comparing the correlation coefficients found using specifications with controls to those found when not including controls indicates a non-significant association (t32 = 0.26, p = .79). This result does not support the hypothesis that correlations present when not including controls in the model are more negative than when controls are included.
| Technology Measure | Significance Measure | Observed [95% CI] | Partial r squared values [95% CI] | p value |
|---|---|---|---|---|
| Self-Report | Effect Size | -0.08 [-0.10, -0.07] | 0.008 [0.006, 0.011] | 0.00 |
| Sig Results | 4 | 0.00 | ||
| Time Spent | Effect Size | -0.02 [-0.04, -0.01] | 0.001 [0.000, 0.002] | 0.00 |
| Sig Results | 5 | 0.00 | ||
| < 30 Minutes Weekday | Effect Size | 0.03 [0.01, 0.05] | 0.001 [0.000, 0.003] | 0.00 |
| Sig Results | 3 | 0.00 | ||
| < 1 Hour Weekday | Effect Size | 0.02 [0.01, 0.04] | 0.001 [0.000, 0.003] | 0.02 |
| Sig Results | 1 | 0.27 |
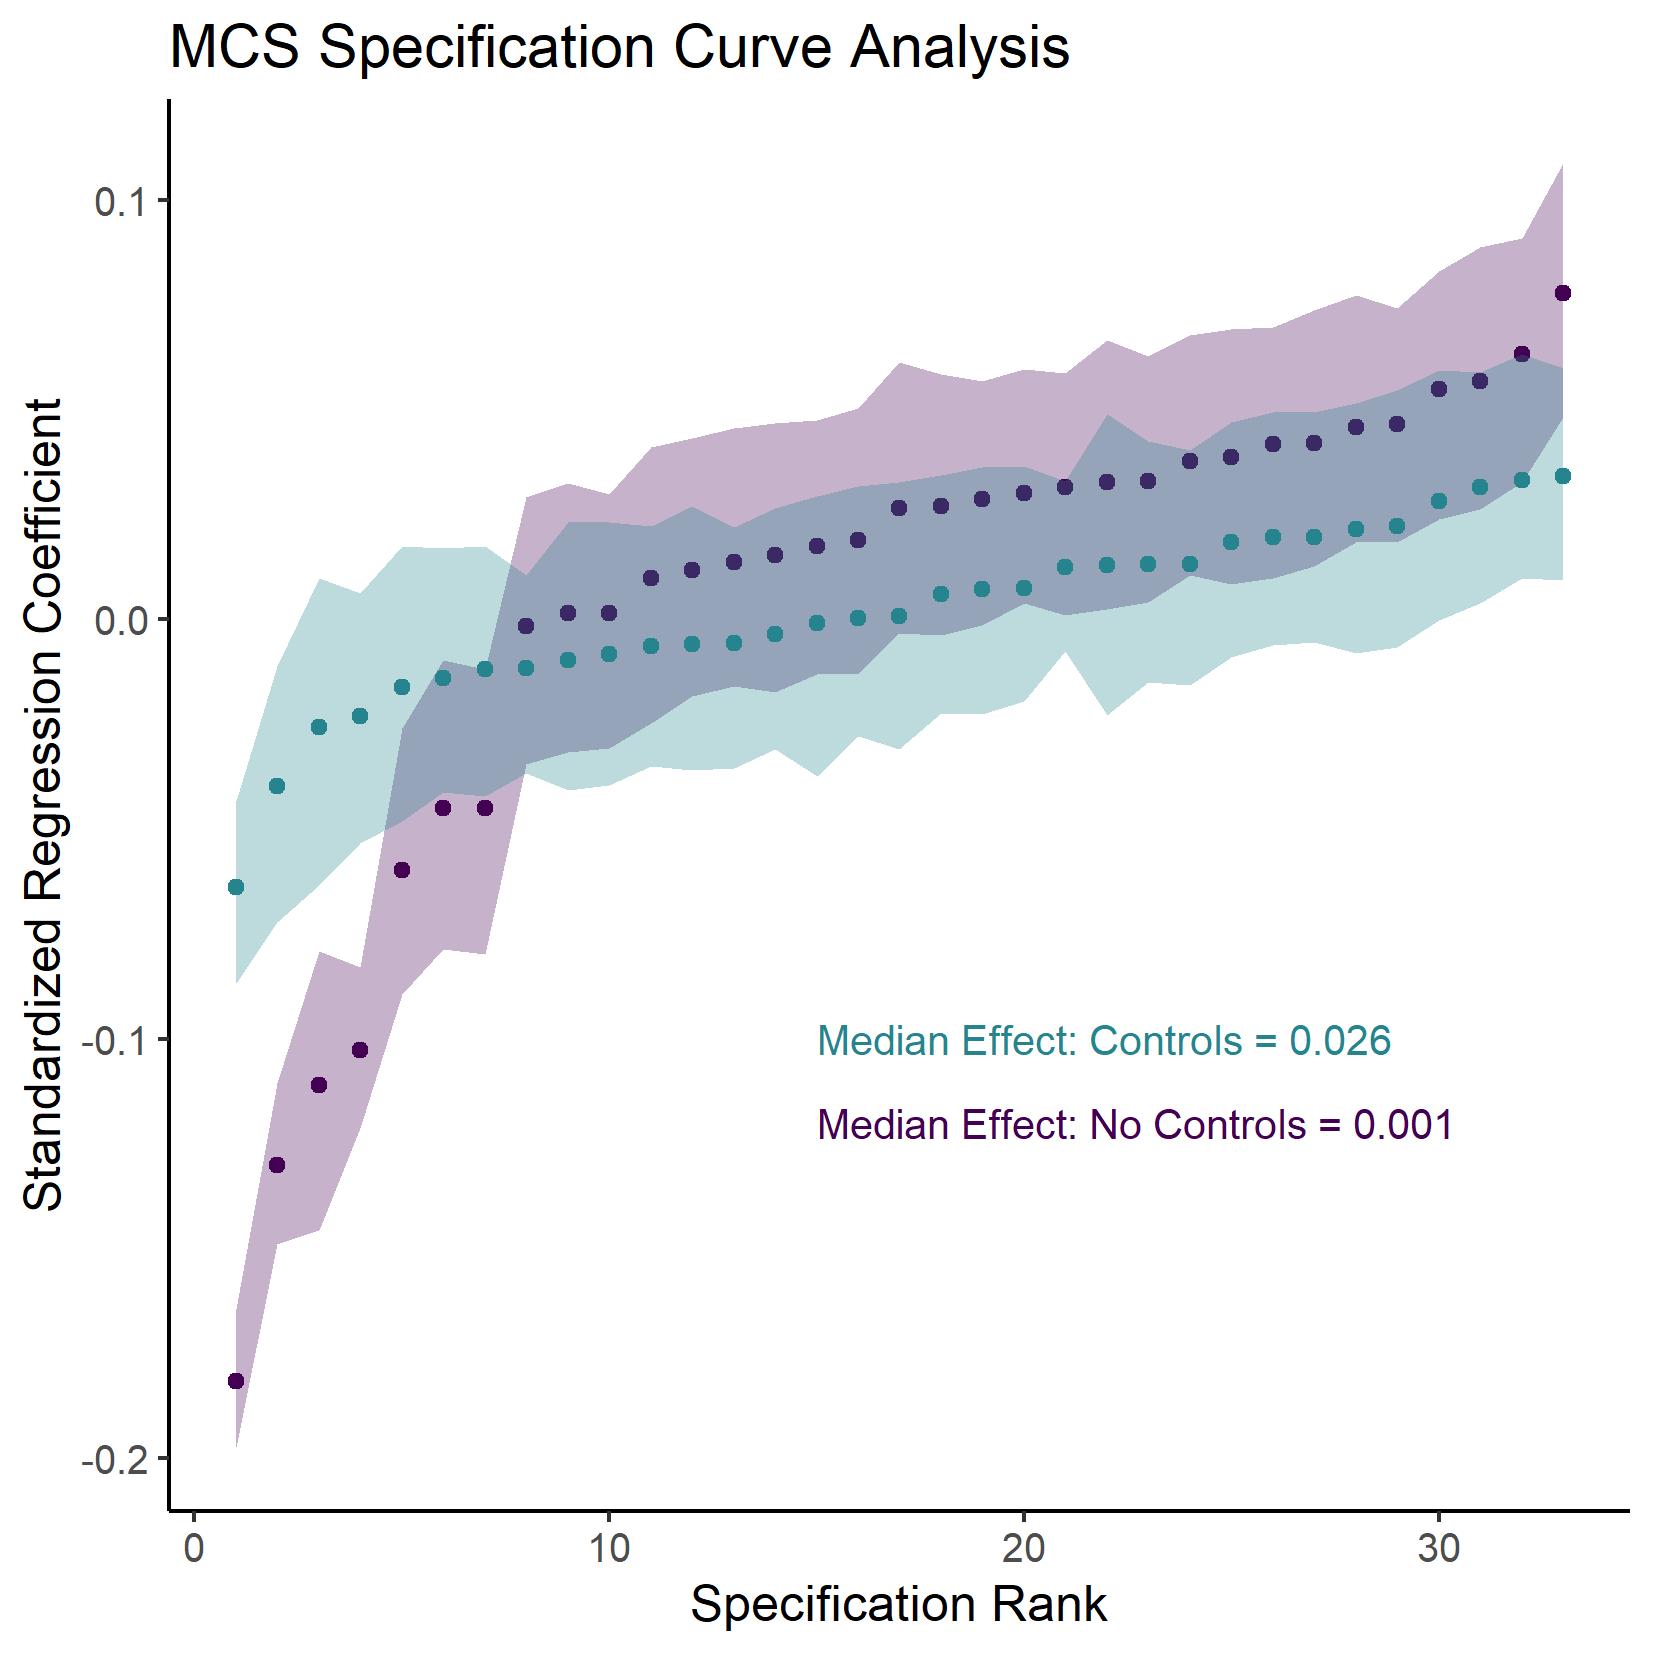
Figure 3.2: Results of the Specification Curve Analysis for the British data. The curve shows the correlation between digital technology use and adolescent well-being, comparing specifications including controls (teal) and no controls (purple).
3.4 Discussion
Because technologies are inherently embedded in our social and professional lives, research concerning digital technology use and its effects on adolescent well-being is under increasingly intense scientific, public and policy scrutiny. It is therefore essential that the psychological evidence contributing to the available literature be of the highest possible standard. There are however considerable problems, ranging from measurement issues, to lack of transparency, little confirmatory work and over-interpretation of miniscule effect sizes (Orben and Przybylski 2019b). Only a few studies regarding technology effects have used a preregistered confirmatory framework (Elson and Przybylski 2017; McCarthy et al. 2016; Przybylski and Weinstein 2017); No large-scale cross-national work has tried to move away from retrospective self-report measures to gauge time spent engaged with digital technologies, yet it has been evident for years that such self-report measures are inherently problematic (Scharkow 2016; Schwarz and Oyserman 2001). Until these three facts are reconciled in the literature, exploratory studies wholly dependent on retrospective accounts will command an outsized share of public attention (Orben 2017).
This chapter marks a novel contribution to the psychological study of technology in a variety of ways. First, it introduces a new measurement of screen time, implements rigorous and transparent approaches to statistical testing and explicitly separates hypothesis generation from hypothesis testing. Given the practical and reputational stakes for psychological science, I firmly argue that this methodological framework should be the new baseline for those wanting to make scientific claims about the effects of digital technology use on human behaviour, development, and well-being.
Second, just like the second chapter, this chapter finds little substantive statistically significant and negative associations between digital technology use and well-being in adolescents. The most negative associations were found when both self-reported technology use and well-being measures were used, which could be a result of common method variance or noise found in such large-scale questionnaire data. Where statistically significant, associations were smaller than my pre-registered cut off for a practically significant effect, even though some 95% CI crossed this pre-registered threshold. In other words, though there were some small statistically significant negative associations, they fell below the prespecified SESOI of a correlation coefficient of r = .10: Digital technology use explained less than 1% of variance in adolescent well-being. This is in line with results from previous research showing that the association between digital technology use and wellbeing often falls below or near this threshold (Ferguson 2009; Orben and Przybylski 2019b; Twenge et al. 2017; Twenge, Martin, and Campbell 2018). I argue that these effects are therefore potentially too small to merit substantial scientific discussion (Lakens, Scheel, and Isager 2018).
This supports previous research and the results of Chapter 2 which show that there is a small significant negative association between technology use and well-being, which – when compared to other activities in an adolescent’s life – is miniscule (Orben and Przybylski 2019b). Whether smaller effects, even when extremely small, are important, is up for debate, as technology use affects the large majority of the population (Rose 2008). Yet this evidence can be interpreted against calls for extreme approaches to decreasing adolescent technology use.
Third, this chapter was also one of the first pieces of research to examine whether digital technology use before bedtime is especially detrimental to adolescent psychological well-being. Public opinion seems to suggest that using digital technologies immediately before bed should be more harmful for teens than screen time spread throughout the day. My exploratory and confirmatory analyses provided very mixed effects: Some were negative while others were positive or inconclusive. This chapter therefore highlights that technology use before bedtime might not be inherently harmful to psychological well-being, even though this is a well-worn idea in both media and public debates.
3.4.1 Limitations
While I aim to implement the best possible analyses of the research questions posed in this paper, there are issues intrinsic to the data that need to be noted. First, time-use diaries as a method for measuring technology use are not inherently problem-free. It could be that the reflexive or brief uses of technology concurrent with other activities are not properly recorded by this method. Likewise, I cannot ensure that all days that were under analysis were representative. To address both issues, one would need to holistically track technology use across multiple devices over multiple days, though doing this with a population representative cohort would be extremely resource intensive (Wilcockson, Ellis, and Shaw 2018). Second, it is important to note that the time-use diary and well-being measures were not collected on the same occasion. Because the well-being measures inquire about feelings in general, instead of just about the feelings on the specific day of questioning, the study assumed that the correlation between both measures still holds as it reflects links between exemplar days and general experiences. Finally, it bears mentioning that the study is correlational, and the directionality of effects cannot, and should not, be inferred from the data.
3.5 Conclusion
Until they are displaced by a new technological innovation, digital technologies will remain a fixture of human experience. Psychological science can provide a powerful tool for quantifying the association between digital technology use and adolescent well-being, yet it routinely fails to supply the robust, objective and replicable evidence necessary to support its findings. As the influence of psychological science on policy and public opinion increases, so must we raise our standards of evidence. This chapter proposes and applies multiple methodological and analytical innovations to set a new standard for quality of psychological research on digital contexts. Granular technology engagement metrics, large-scale data, using specification curve analysis to generate hypotheses and preregistration for hypothesis testing should form the basis of a future methodological framework (Wagenmakers et al. 2012). To retain the influence and trust we often take for granted as a psychological research community, robust and transparent research practices will need to become the norm – not the exception.
3.6 Acknowledgements
This chapter is based on the published work Orben, A., & Przybylski, A. K. (2019). Screens, Teens, and Psychological Well-Being: Evidence From Three Time-Use-Diary Studies. Psychological Science.
The National Institutes of Health (R01-HD069609/R01-AG040213), and National Science Foundation (SES-1157698/1623684) supported PSID. The Department of Children and Youth Affairs funded Growing Up in Ireland, carried out by the Economic and Social Research Institute and Trinity College Dublin. The Centre for Longitudinal Studies, UCL Institute of Education collected MCS and the UK Data Archive/UK Data Service provided the data; They bear no responsibility for its analysis or interpretation. I also thank J. M. Rohrer for providing open access code, on which parts of my analyses are based.