C Appendix C: Improving Data
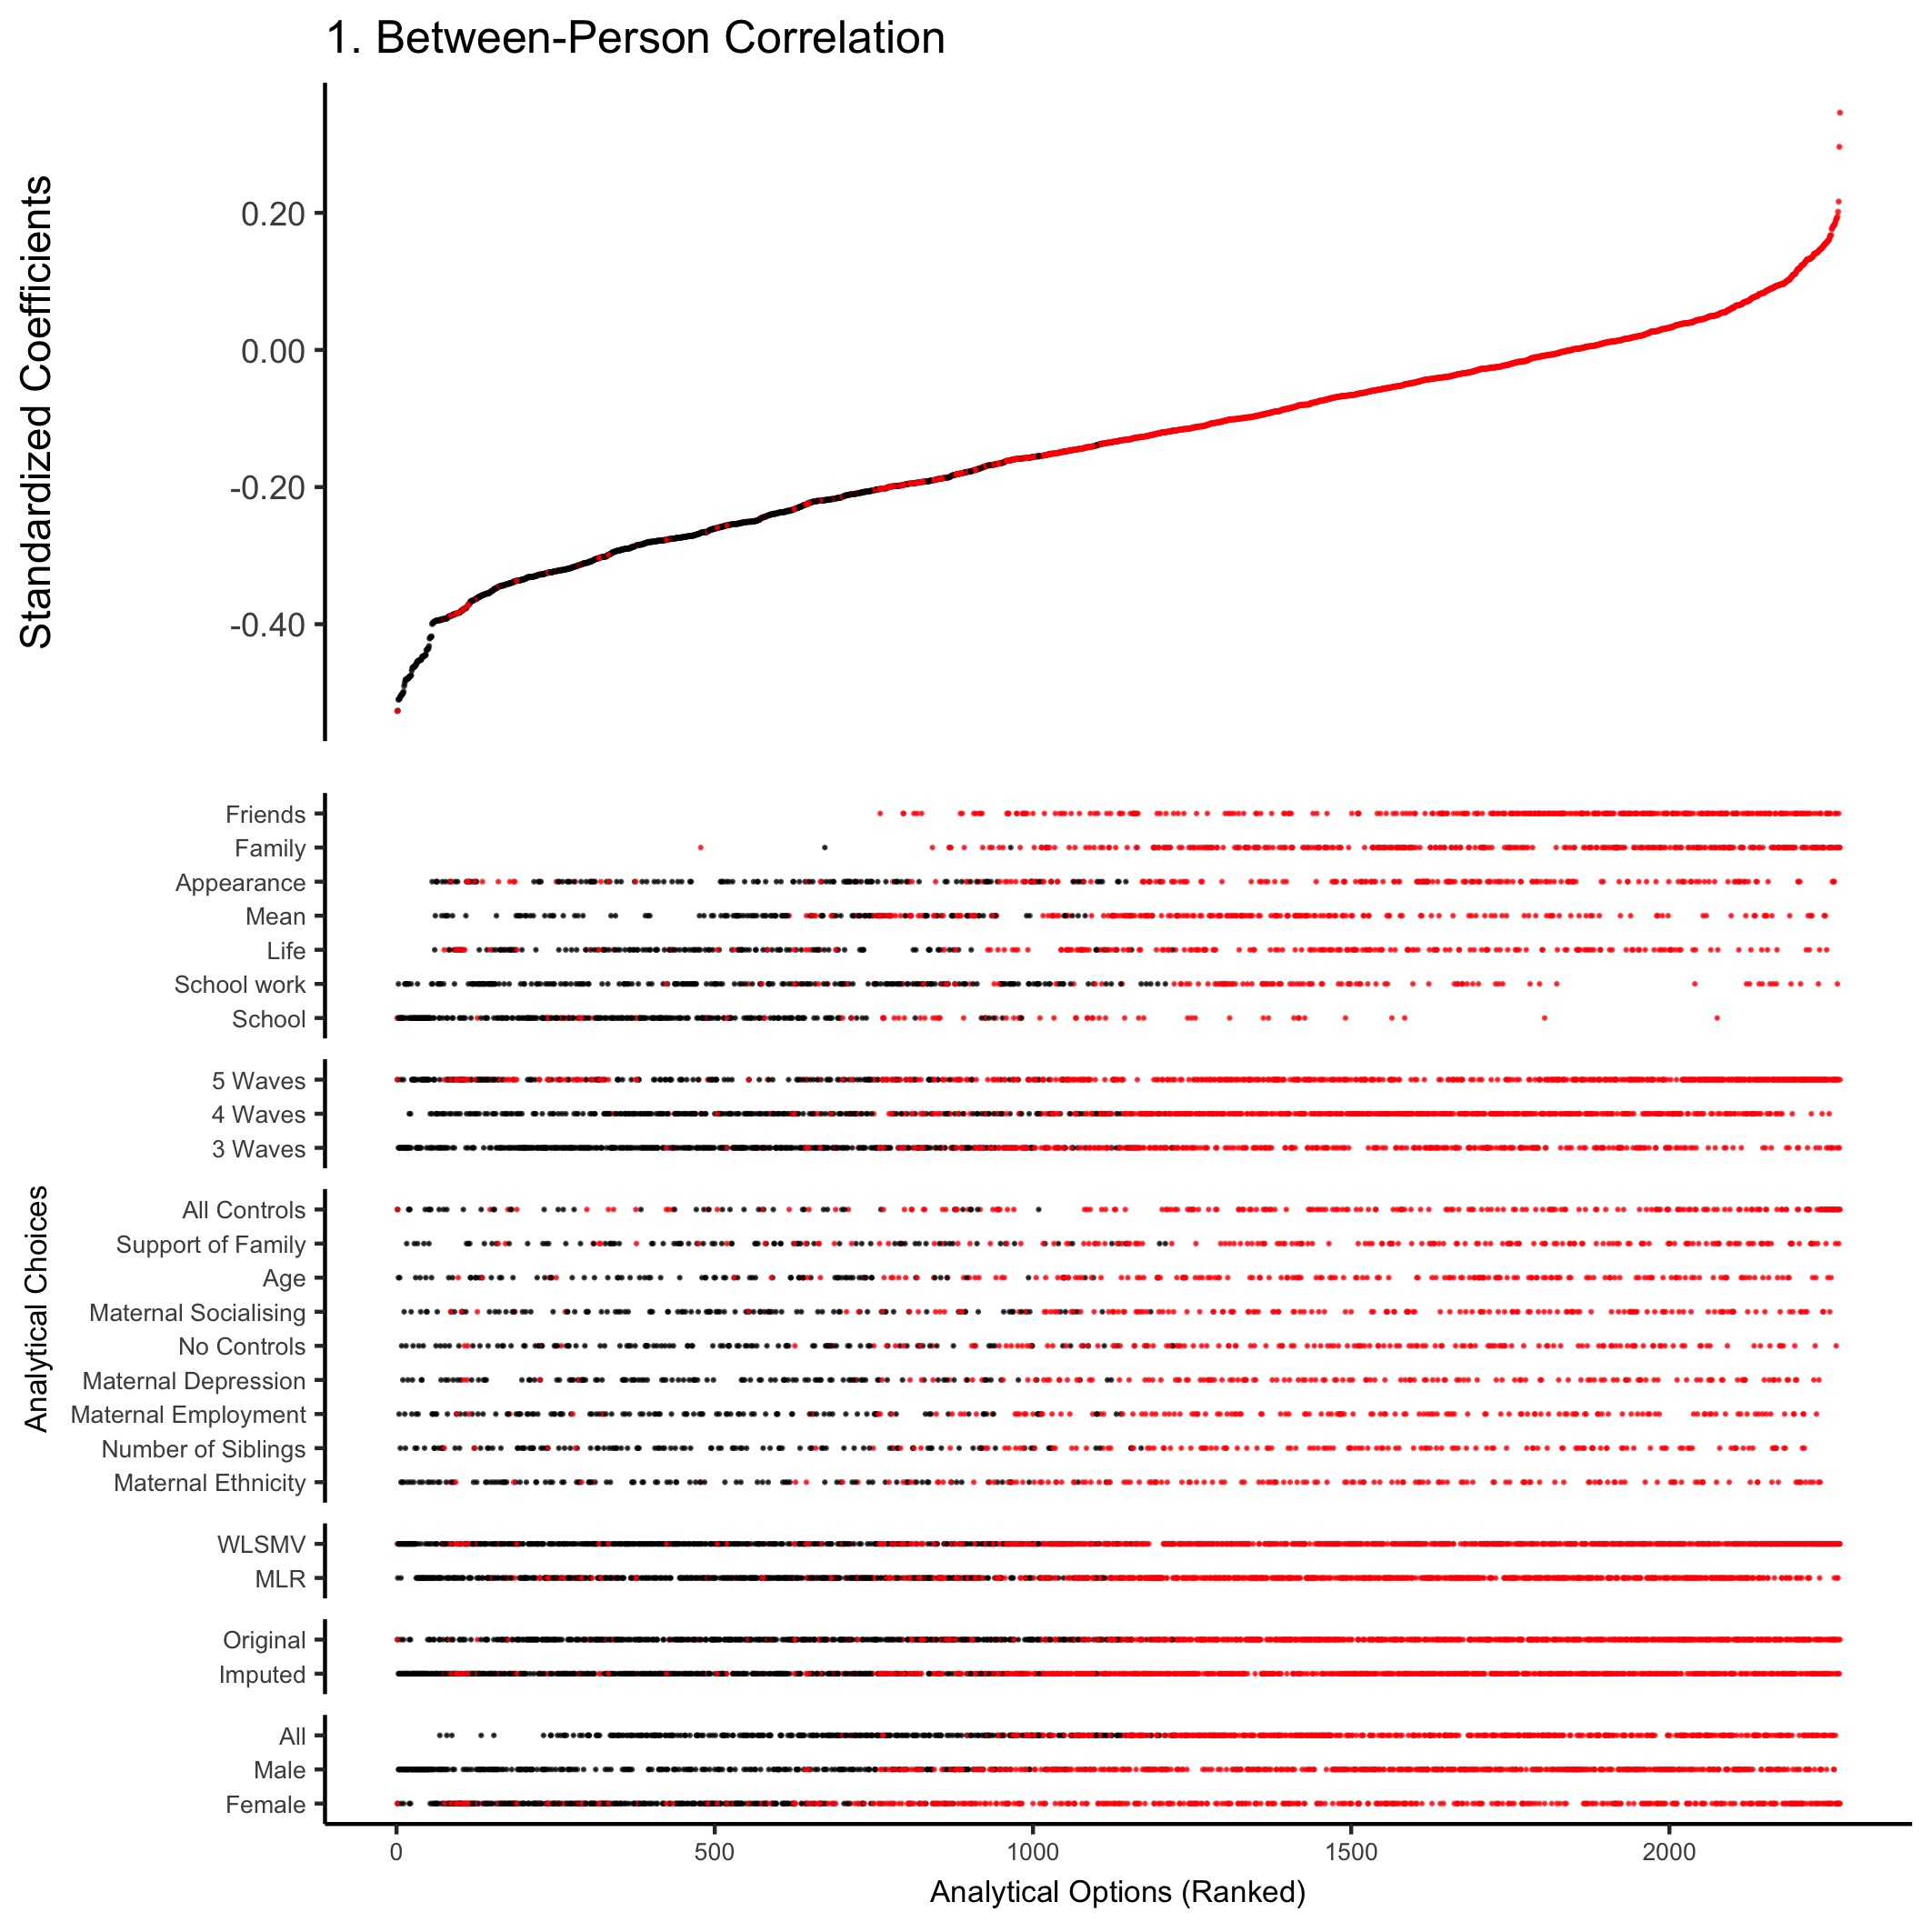
Figure C.1: Between-Person Correlations: Results of a Random-Intercept Cross Lagged Panel Model Specification Curve Analysis relating social media use and life satisfaction. Each point on the x-axis represents a different combination of analytical decisions (i.e. life satisfaction domain, gender, number of waves, estimator, data imputation and control variables). The dashboard shows all the analytical decisions.
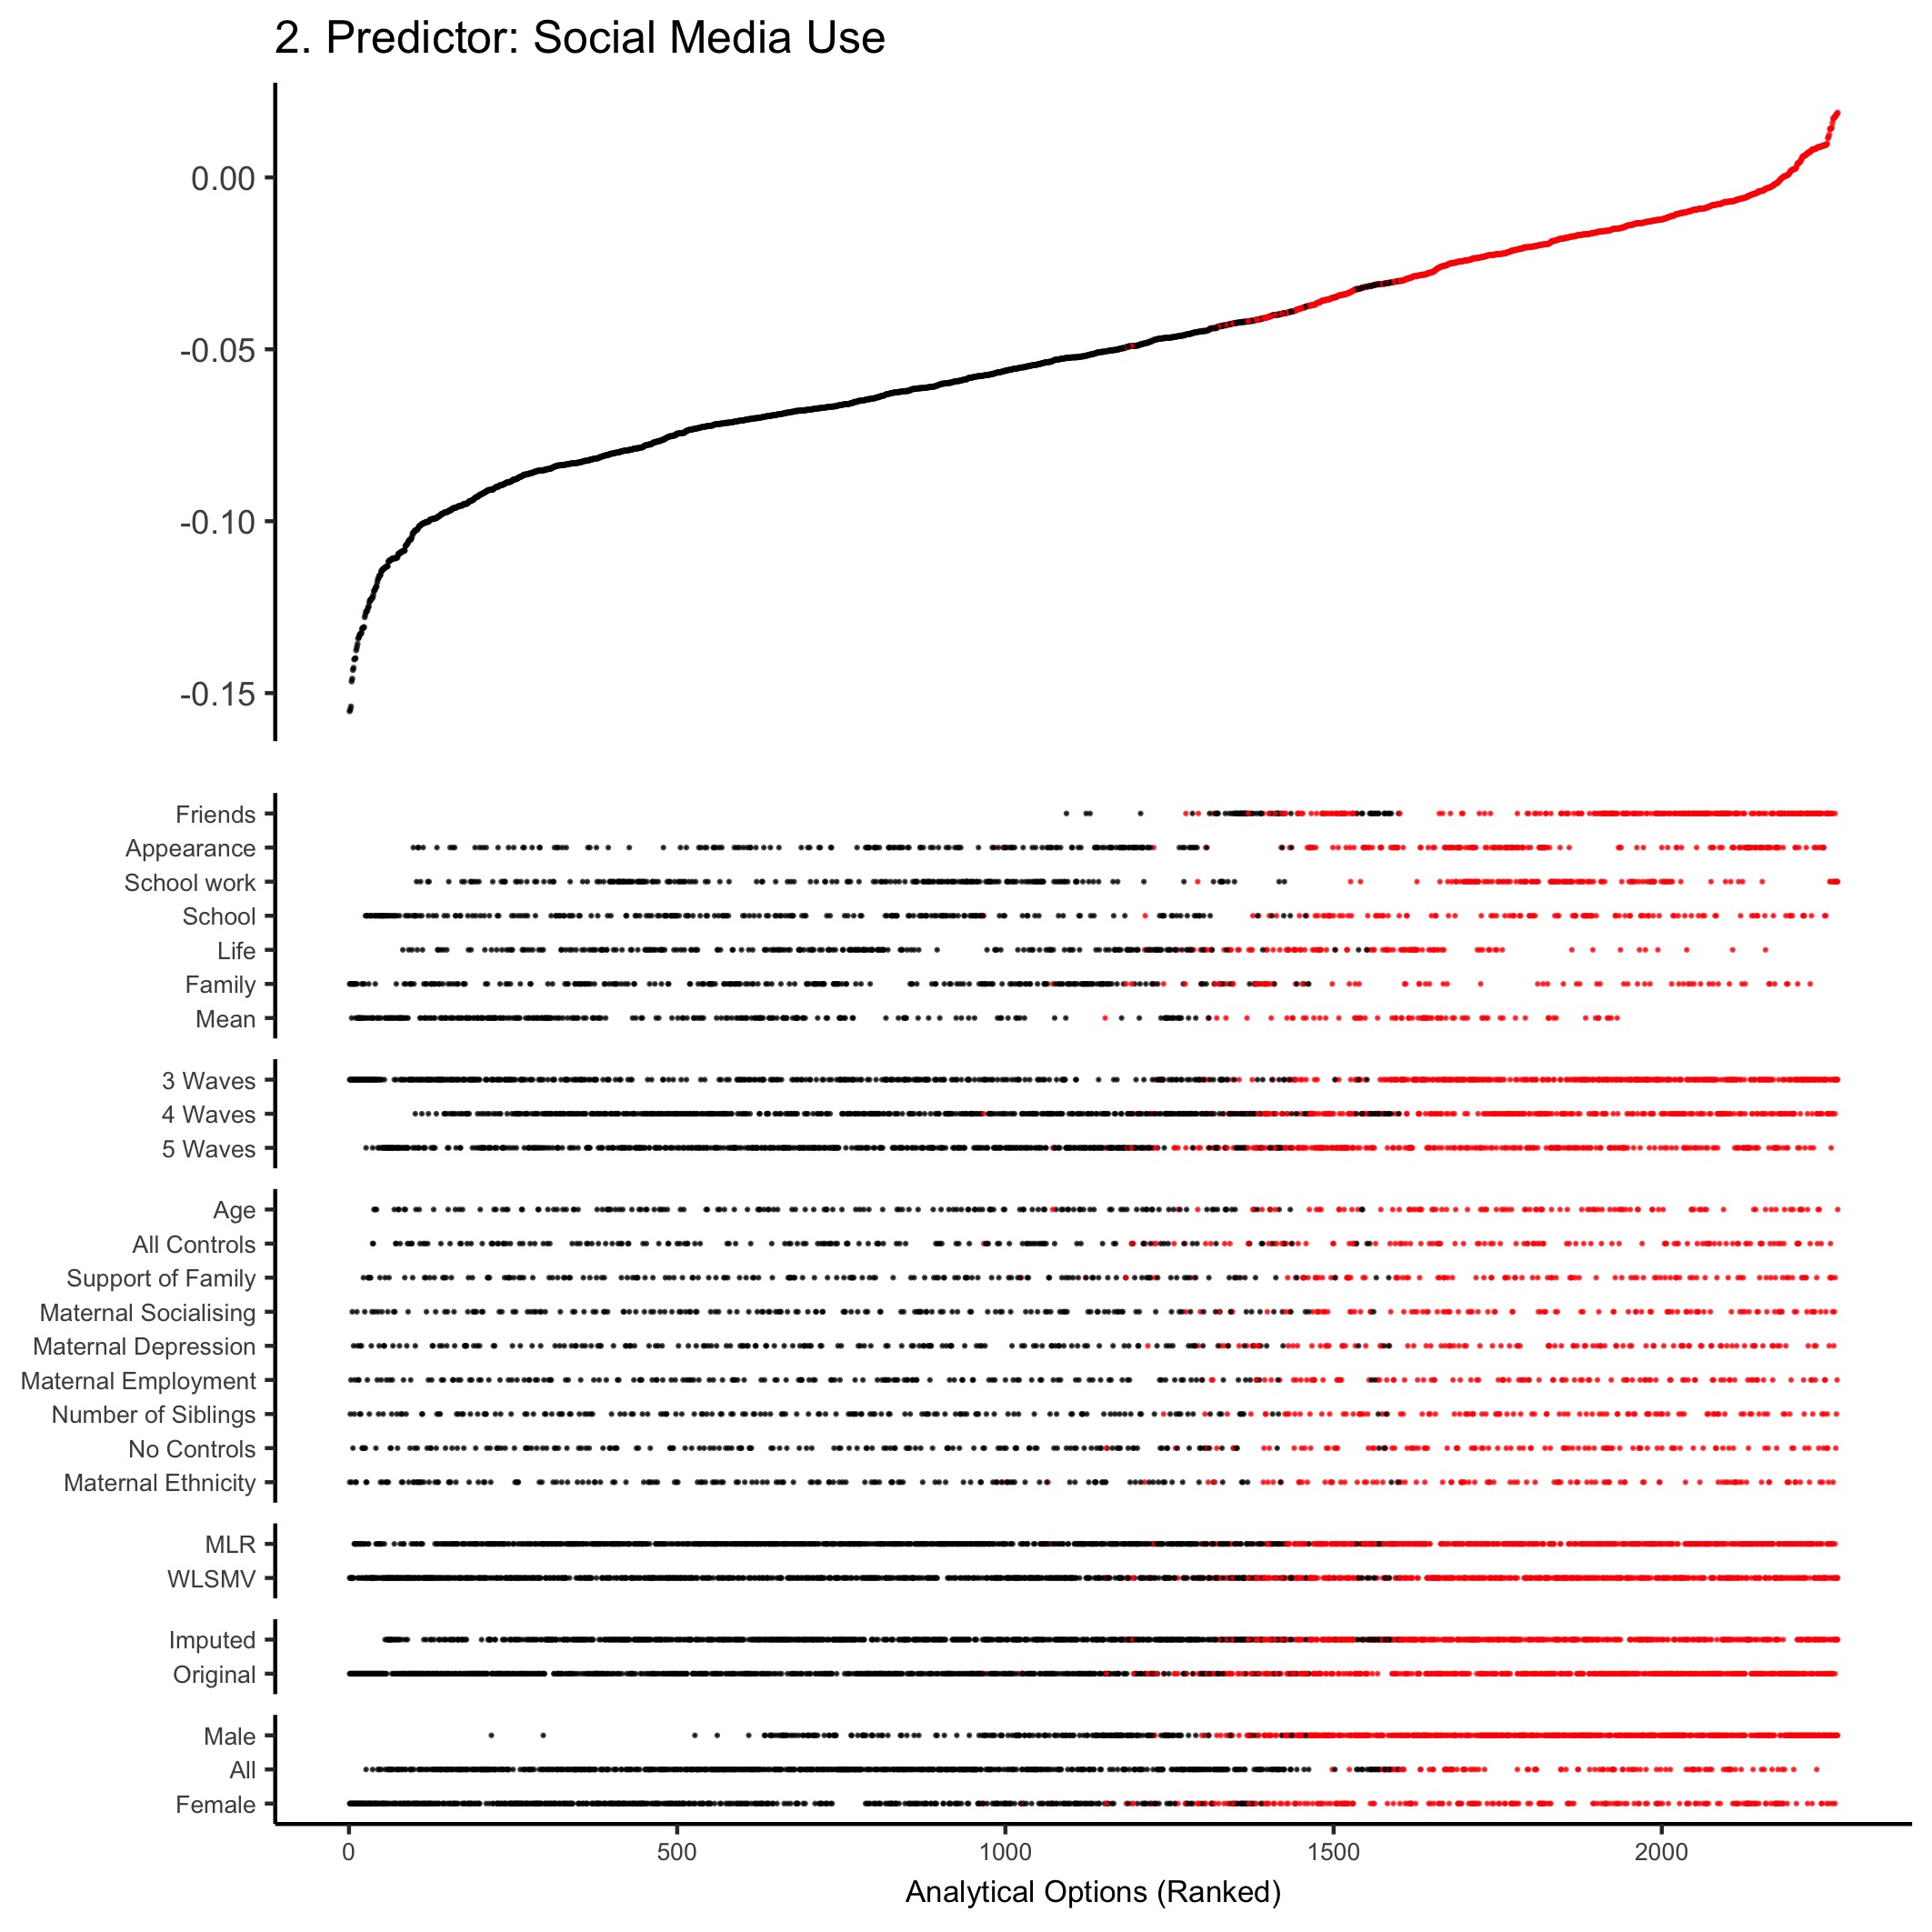
Figure C.2: Within-Person Effect of Social Media Use predicting Well-Being: Results of a Random-Intercept Cross Lagged Panel Model Specification Curve Analysis relating social media use and life satisfaction. Each point on the x-axis represents a different combination of analytical decisions (i.e. life satisfaction domain, gender, number of waves, estimator, data imputation and control variables). The dashboard shows all the analytical decisions.
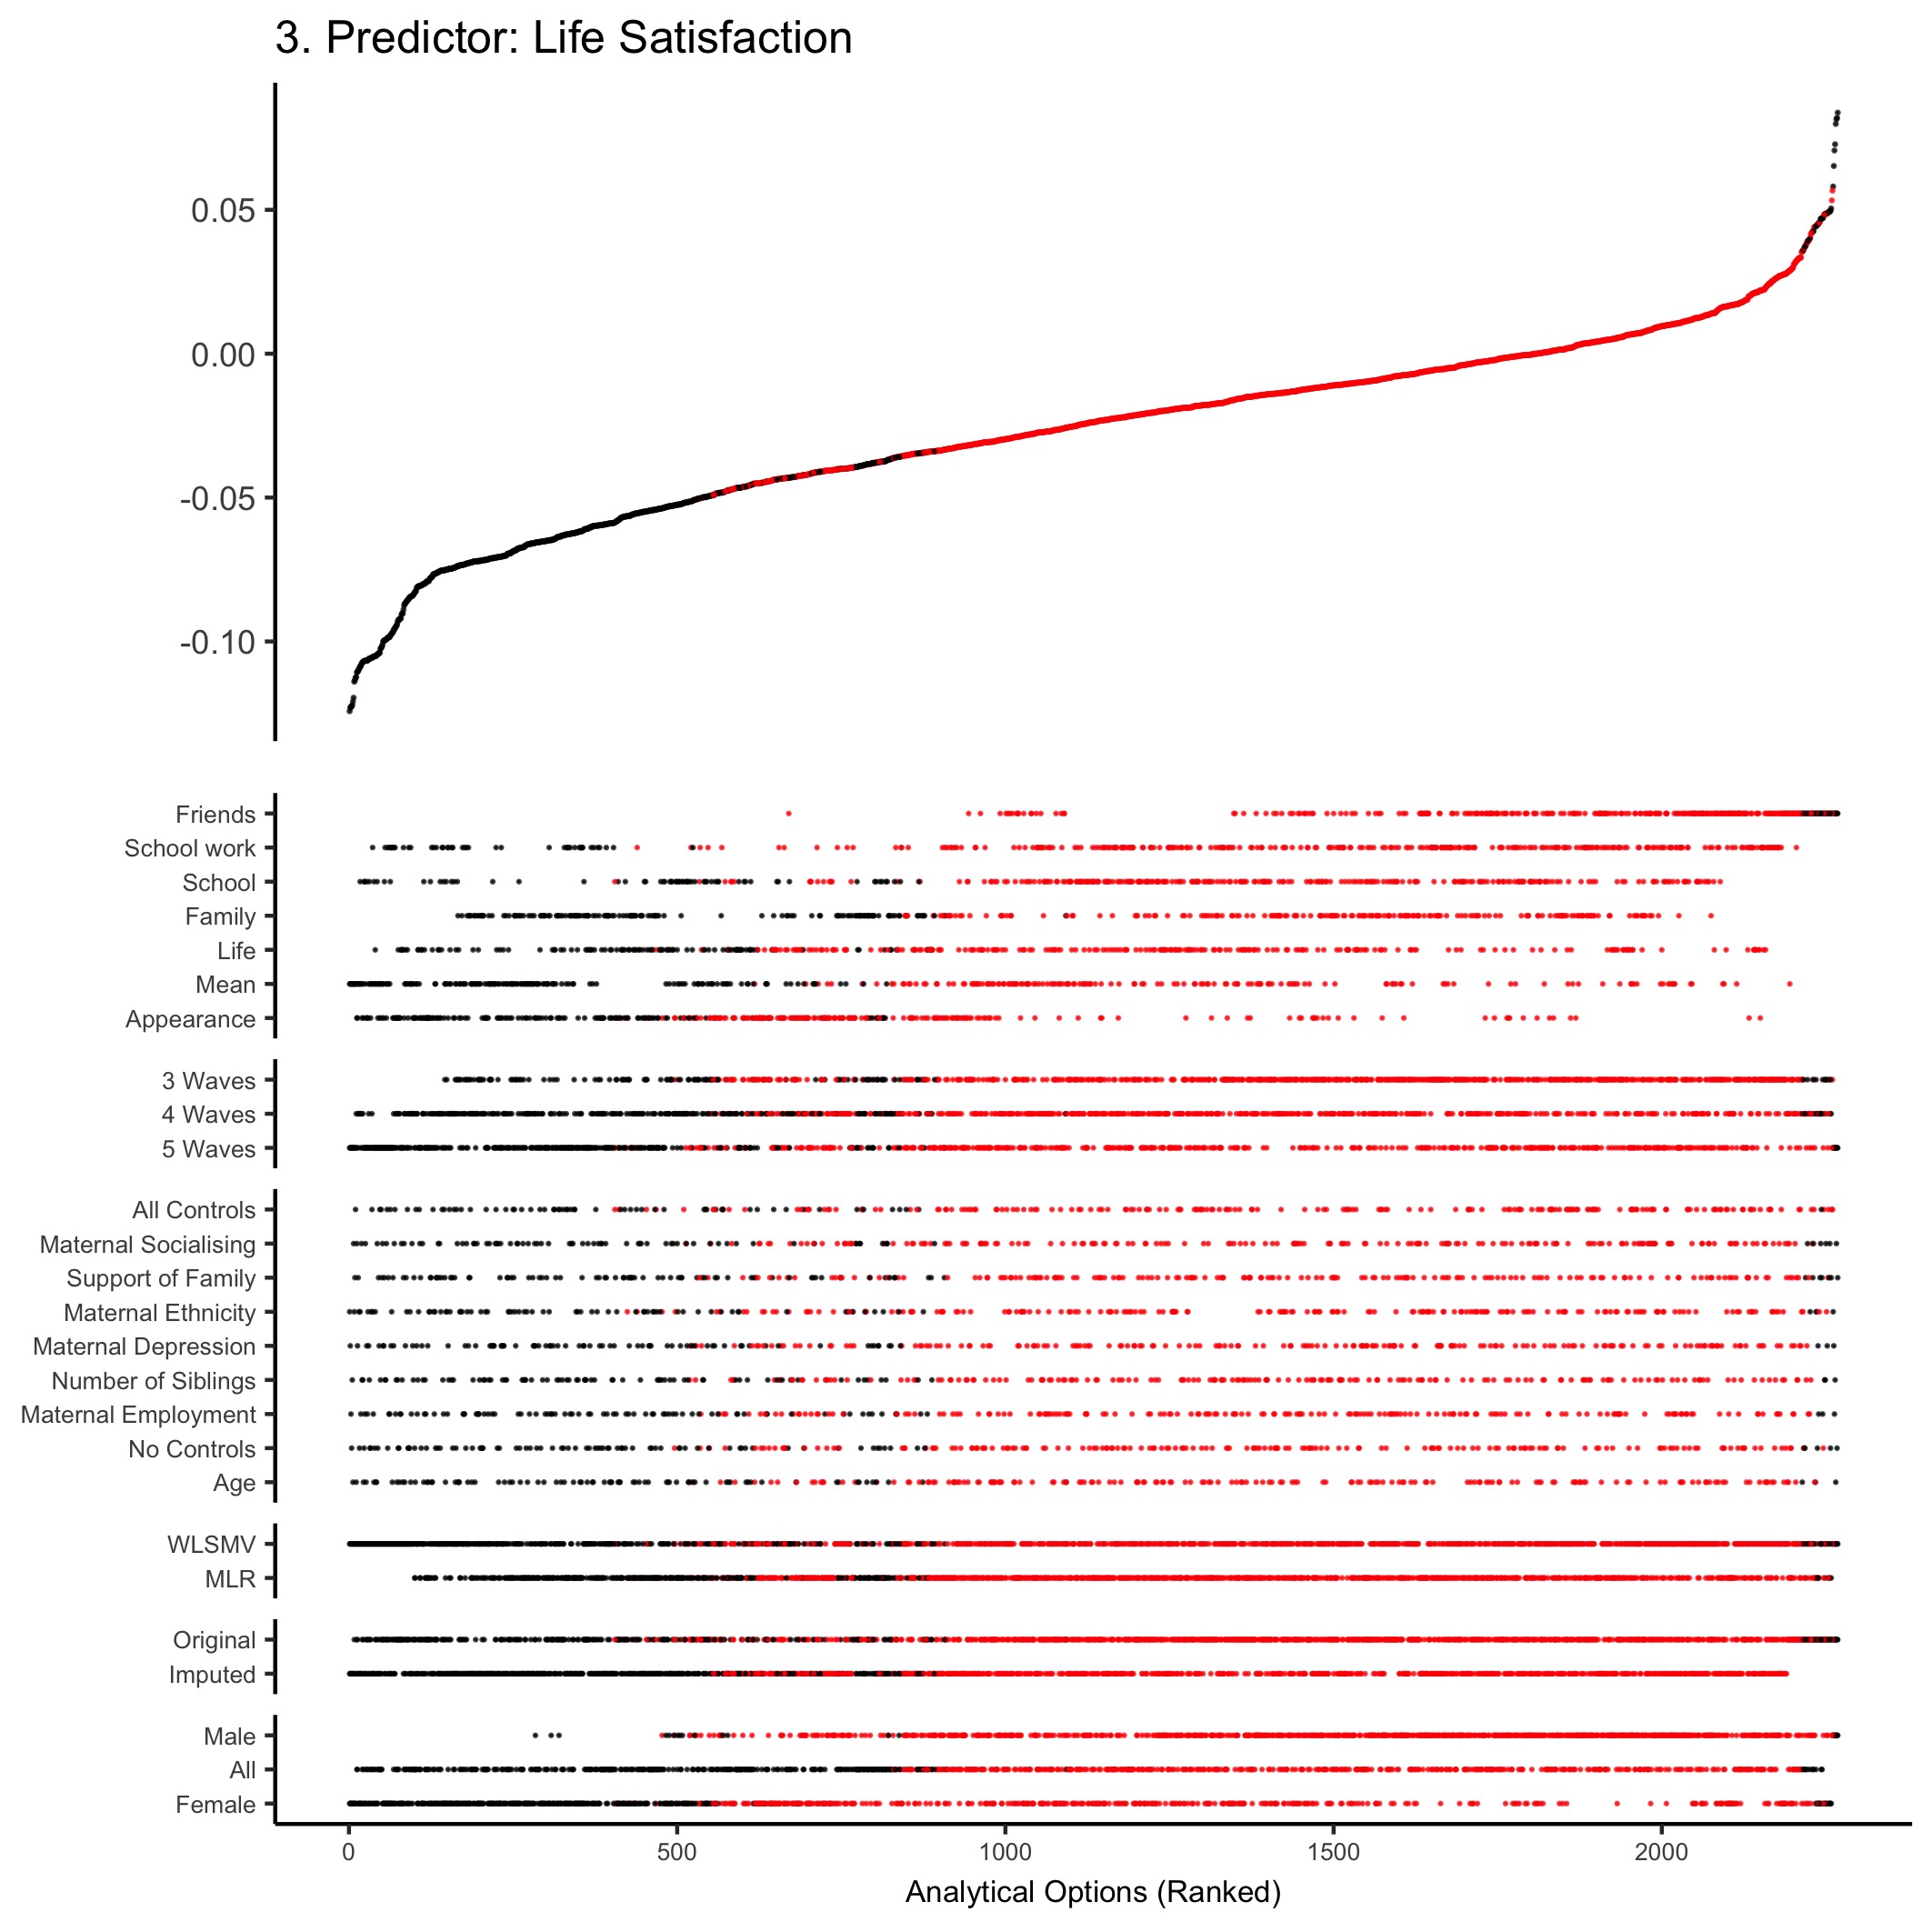
Figure C.3: Within-Person Effect of Well-Being predicting Social Media Use: Results of a Random-Intercept Cross Lagged Panel Model Specification Curve Analysis relating social media use and life satisfaction. Each point on the x-axis represents a different combination of analytical decisions (i.e. life satisfaction domain, gender, number of waves, estimator, data imputation and control variables). The dashboard shows all the analytical decisions.
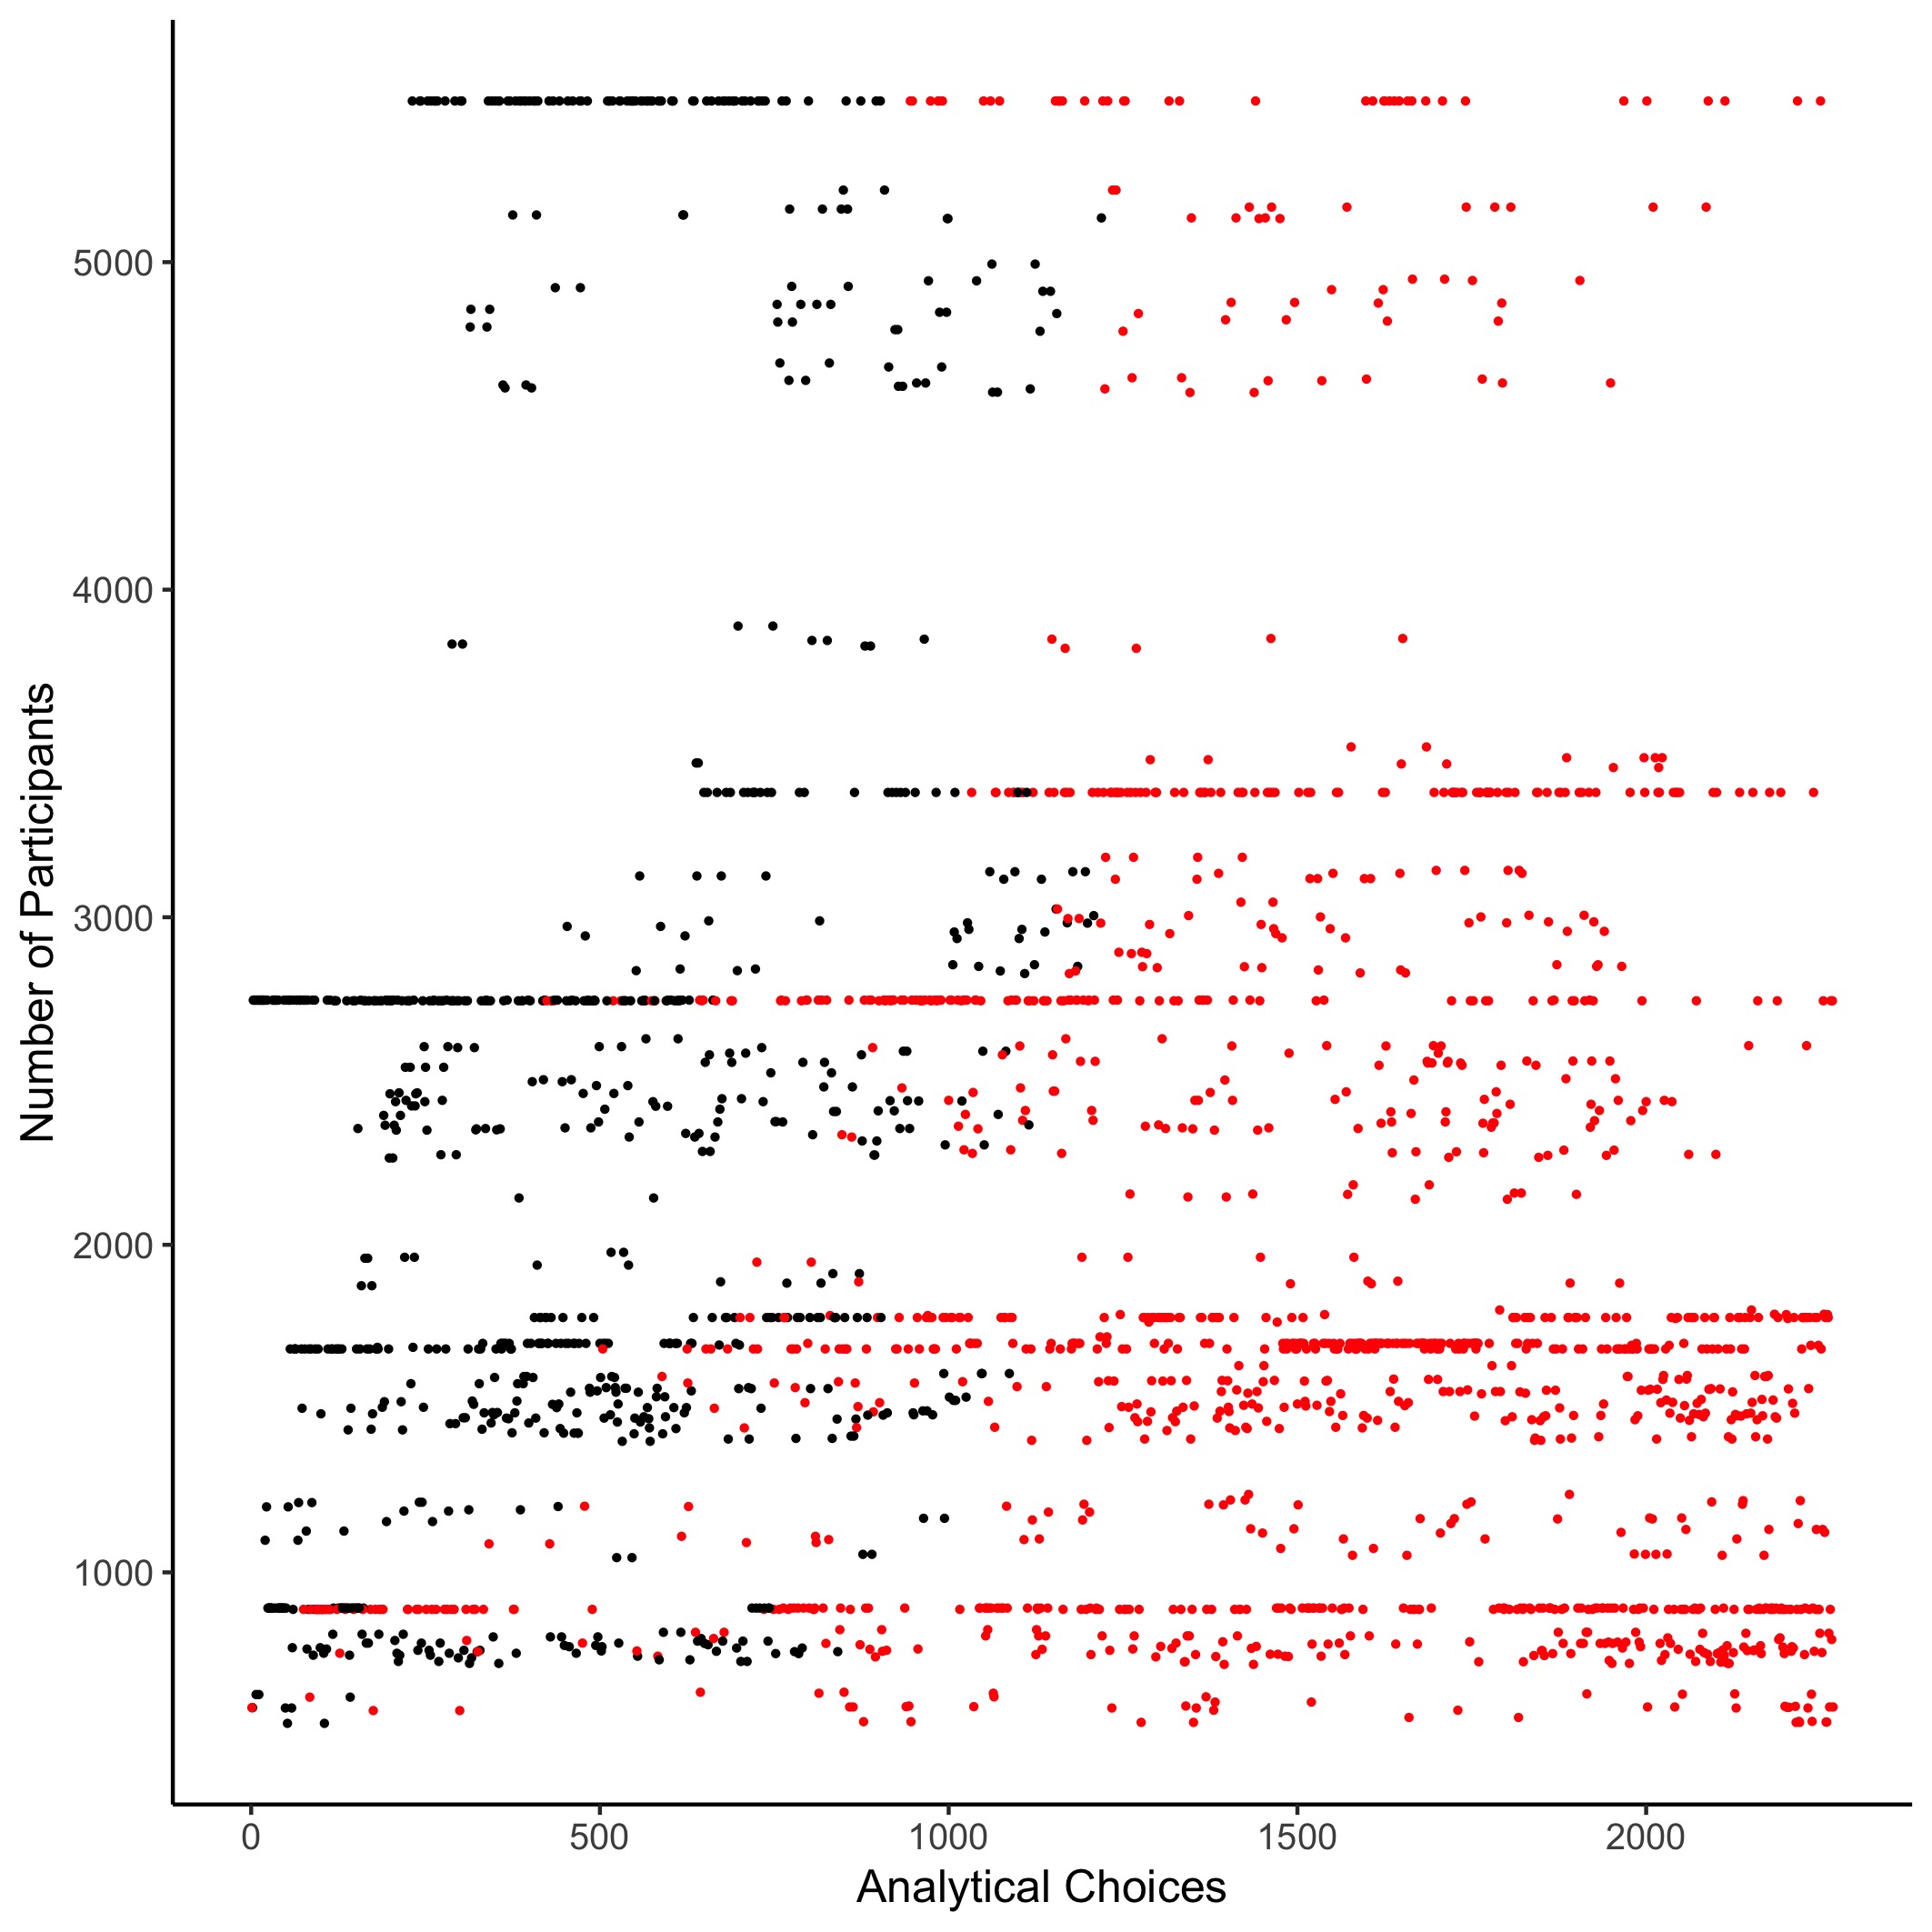
Figure C.4: Number of observations (participants) for each specification analysed in the Random Intercept Cross Lagged Panel Model. This graph shows the between-person correlation. Red dots indicate when the specification was non-significant, while black dots show significant specifications.
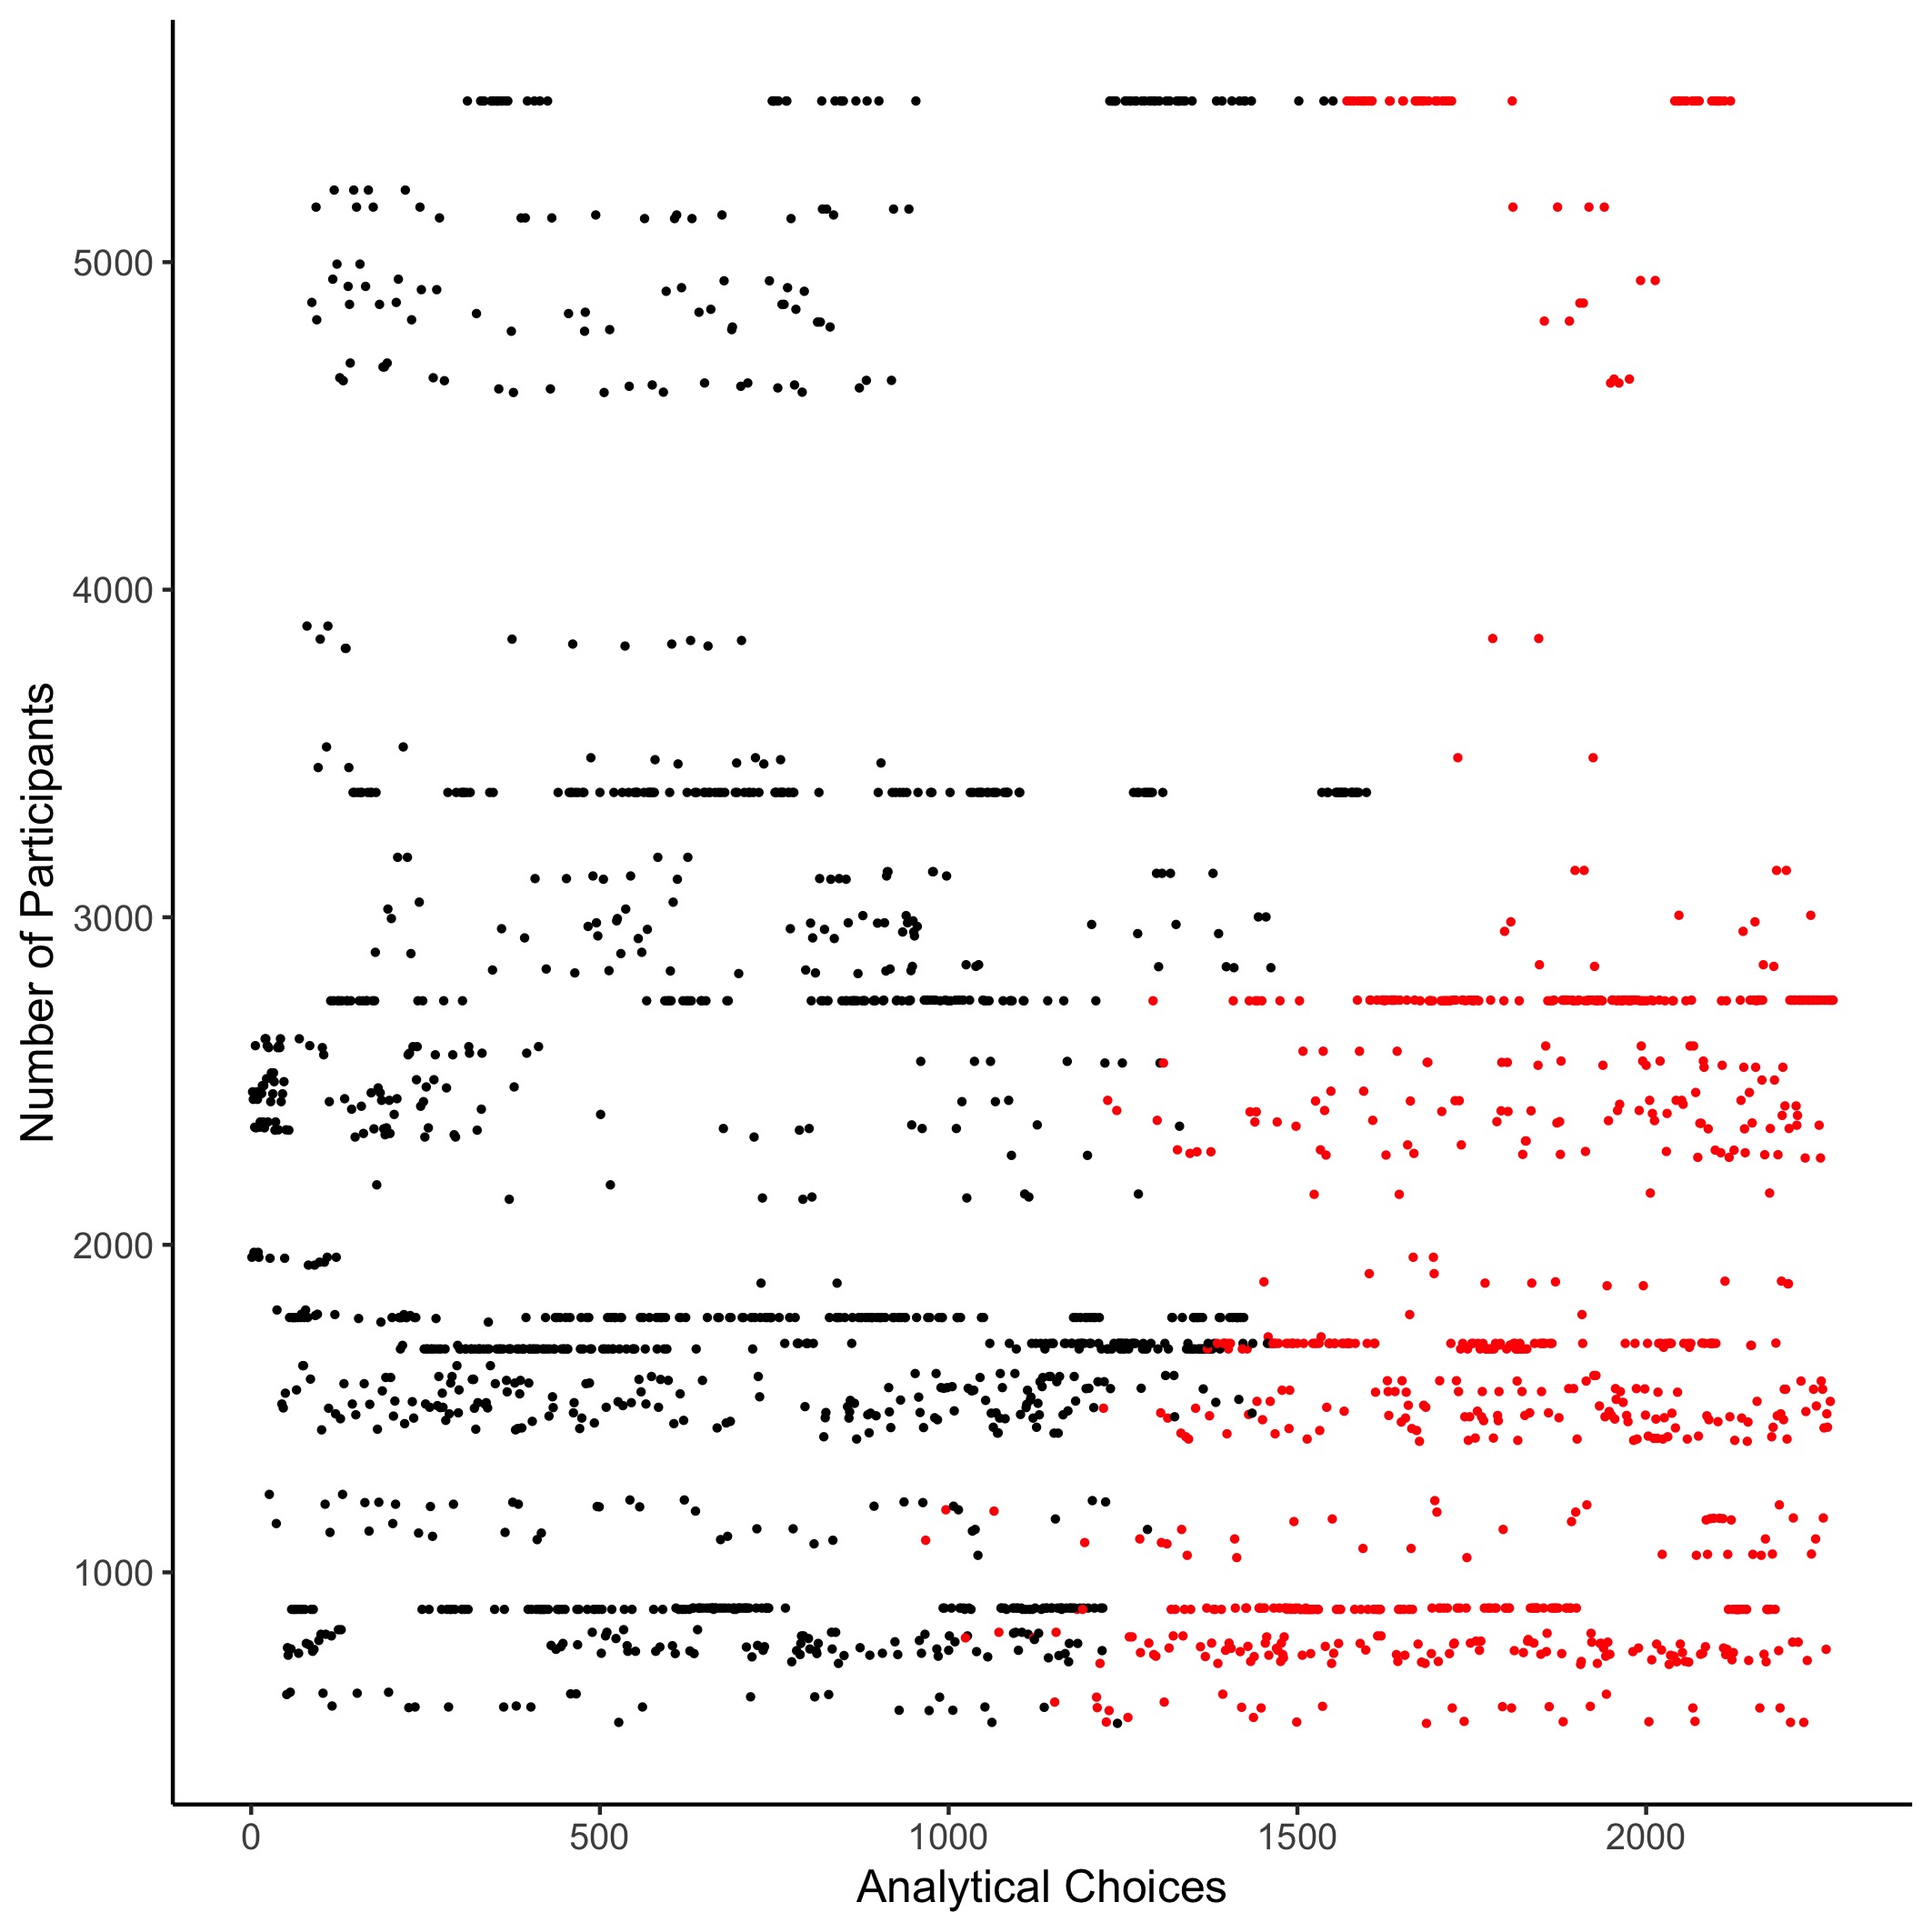
Figure C.5: Number of observations (participants) for each specification analysed in the Random Intercept Cross Lagged Panel Model. This graph shows the within-person effect of social media use predicting well-being. Red dots indicate when the specification was non-significant, while black dots show significant specifications.
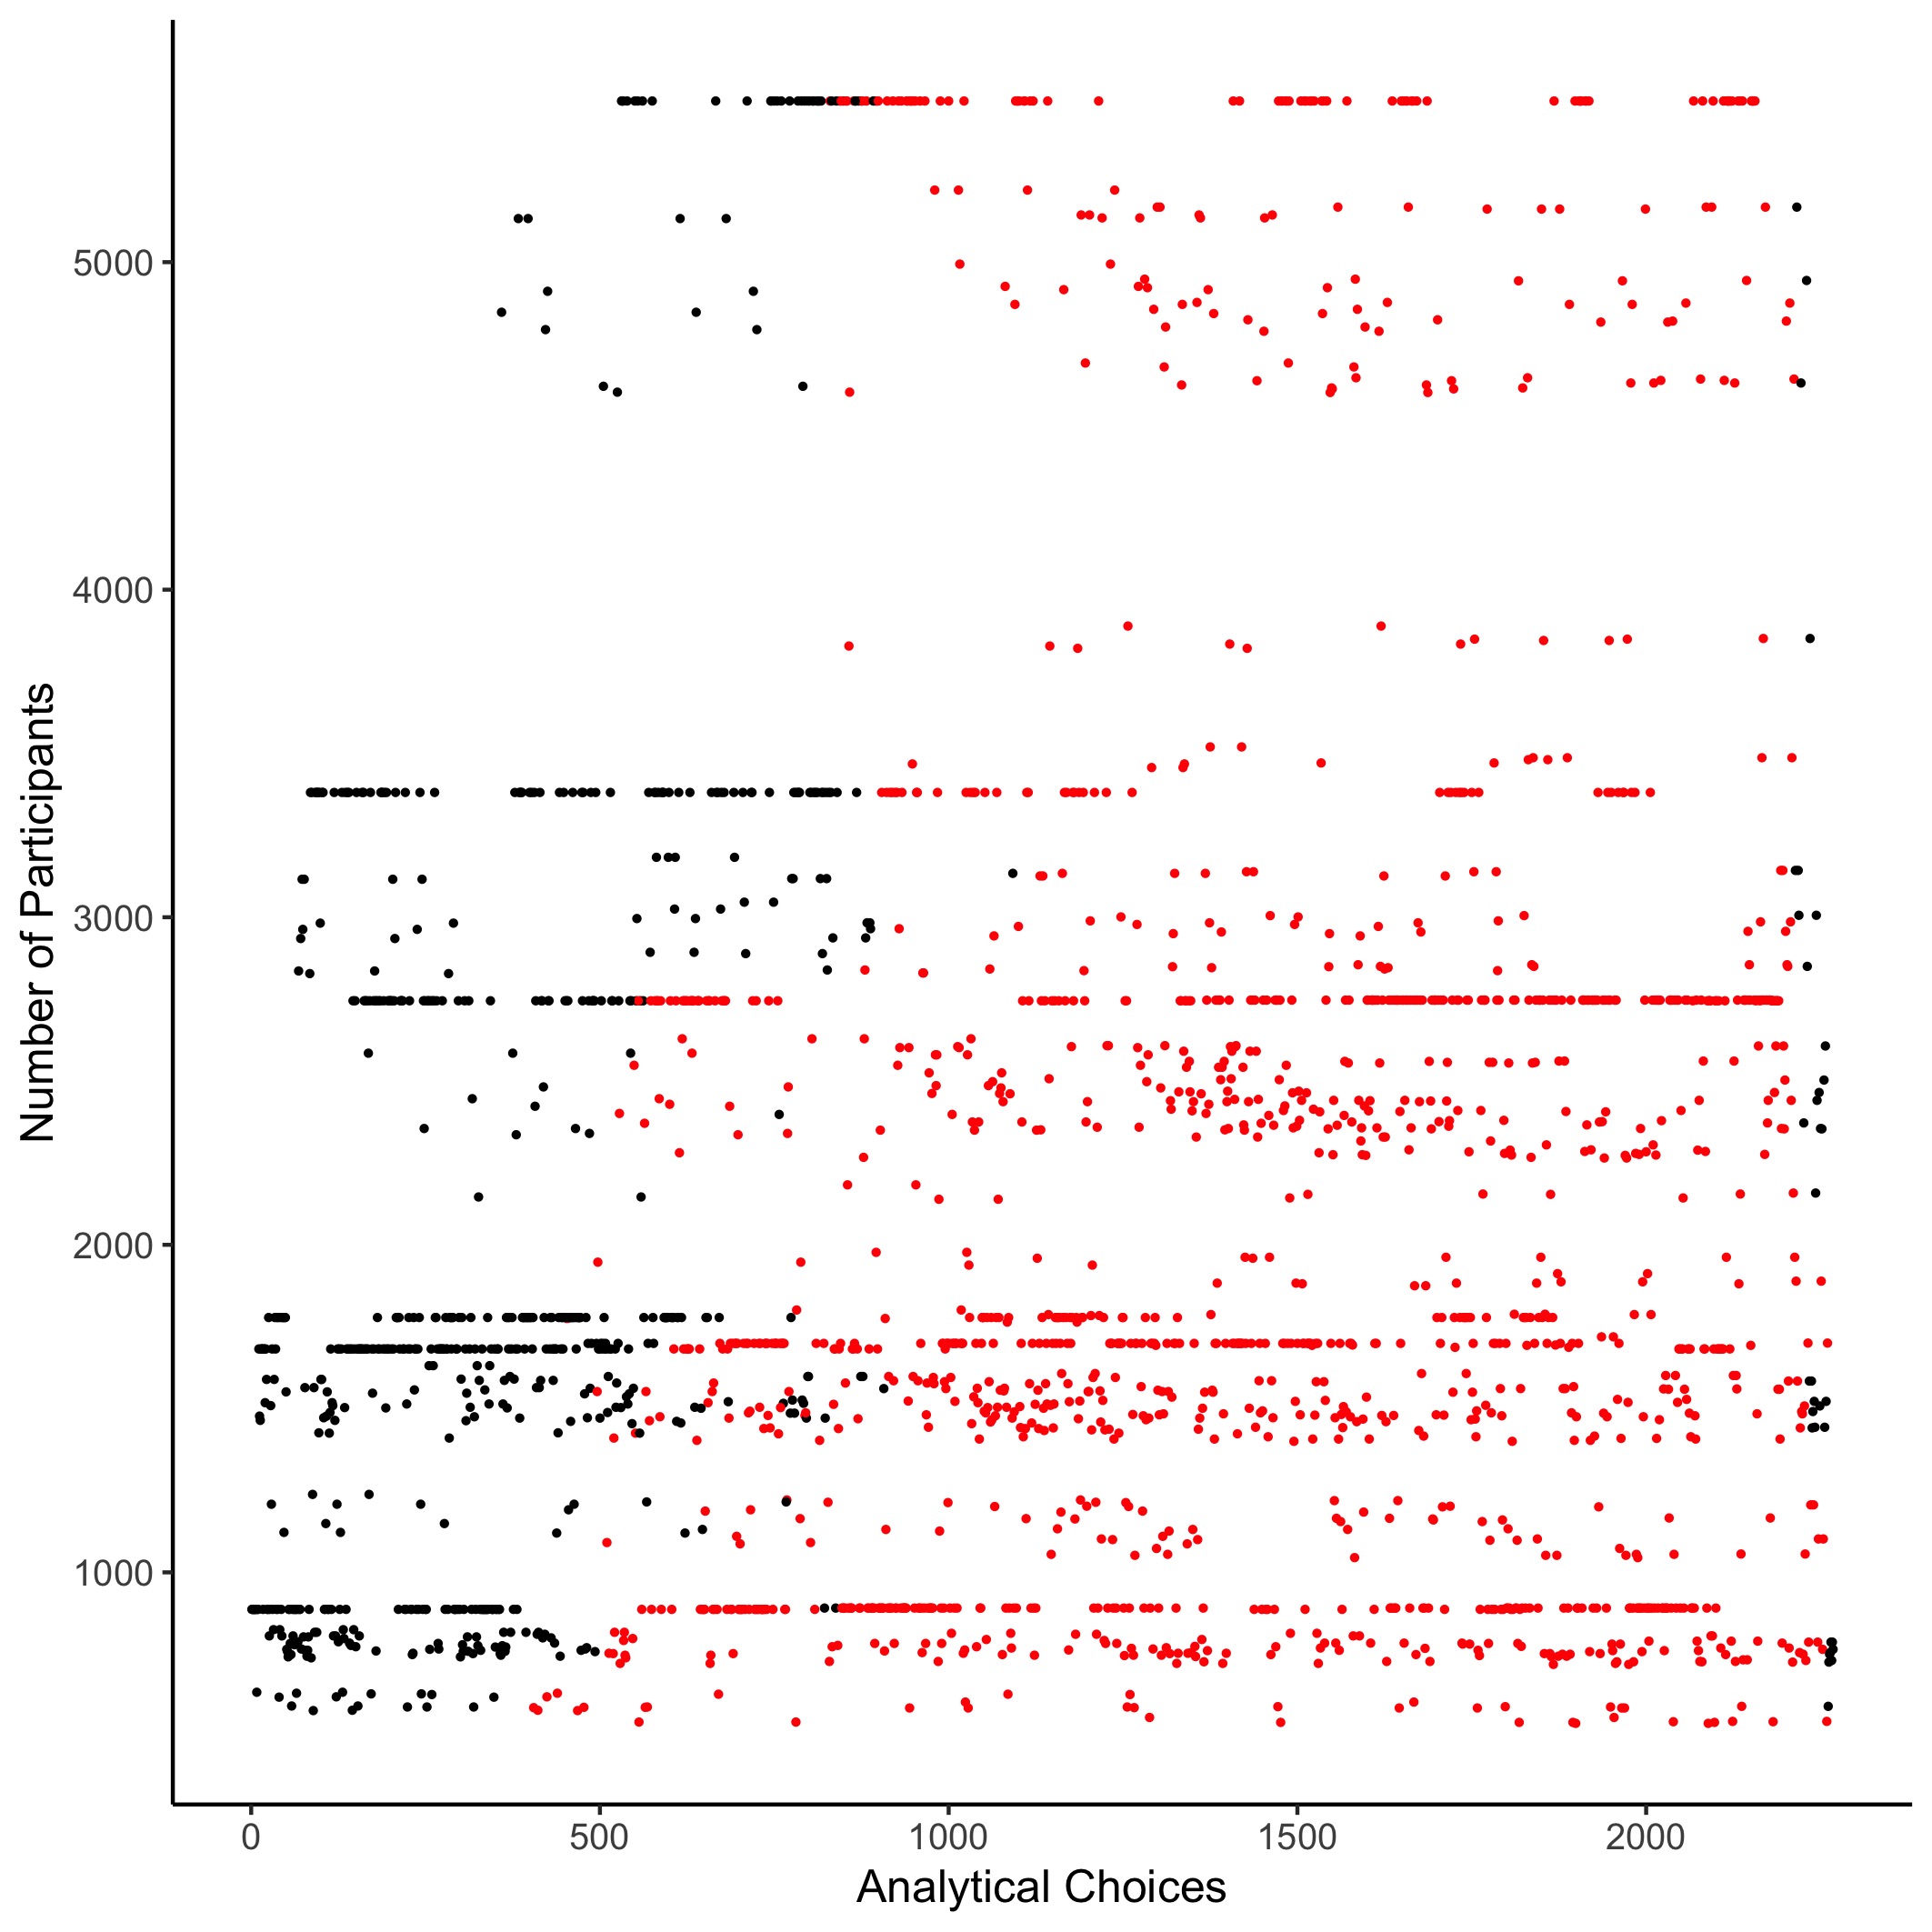
Figure C.6: Number of observations (participants) for each specification analysed in the Random Intercept Cross Lagged Panel Model. This graph shows the within-person effect of well-being predicting social media use. Red dots indicate when the specification was non-significant, while black dots show significant specifications.