A Appendix A: Improving Transparency
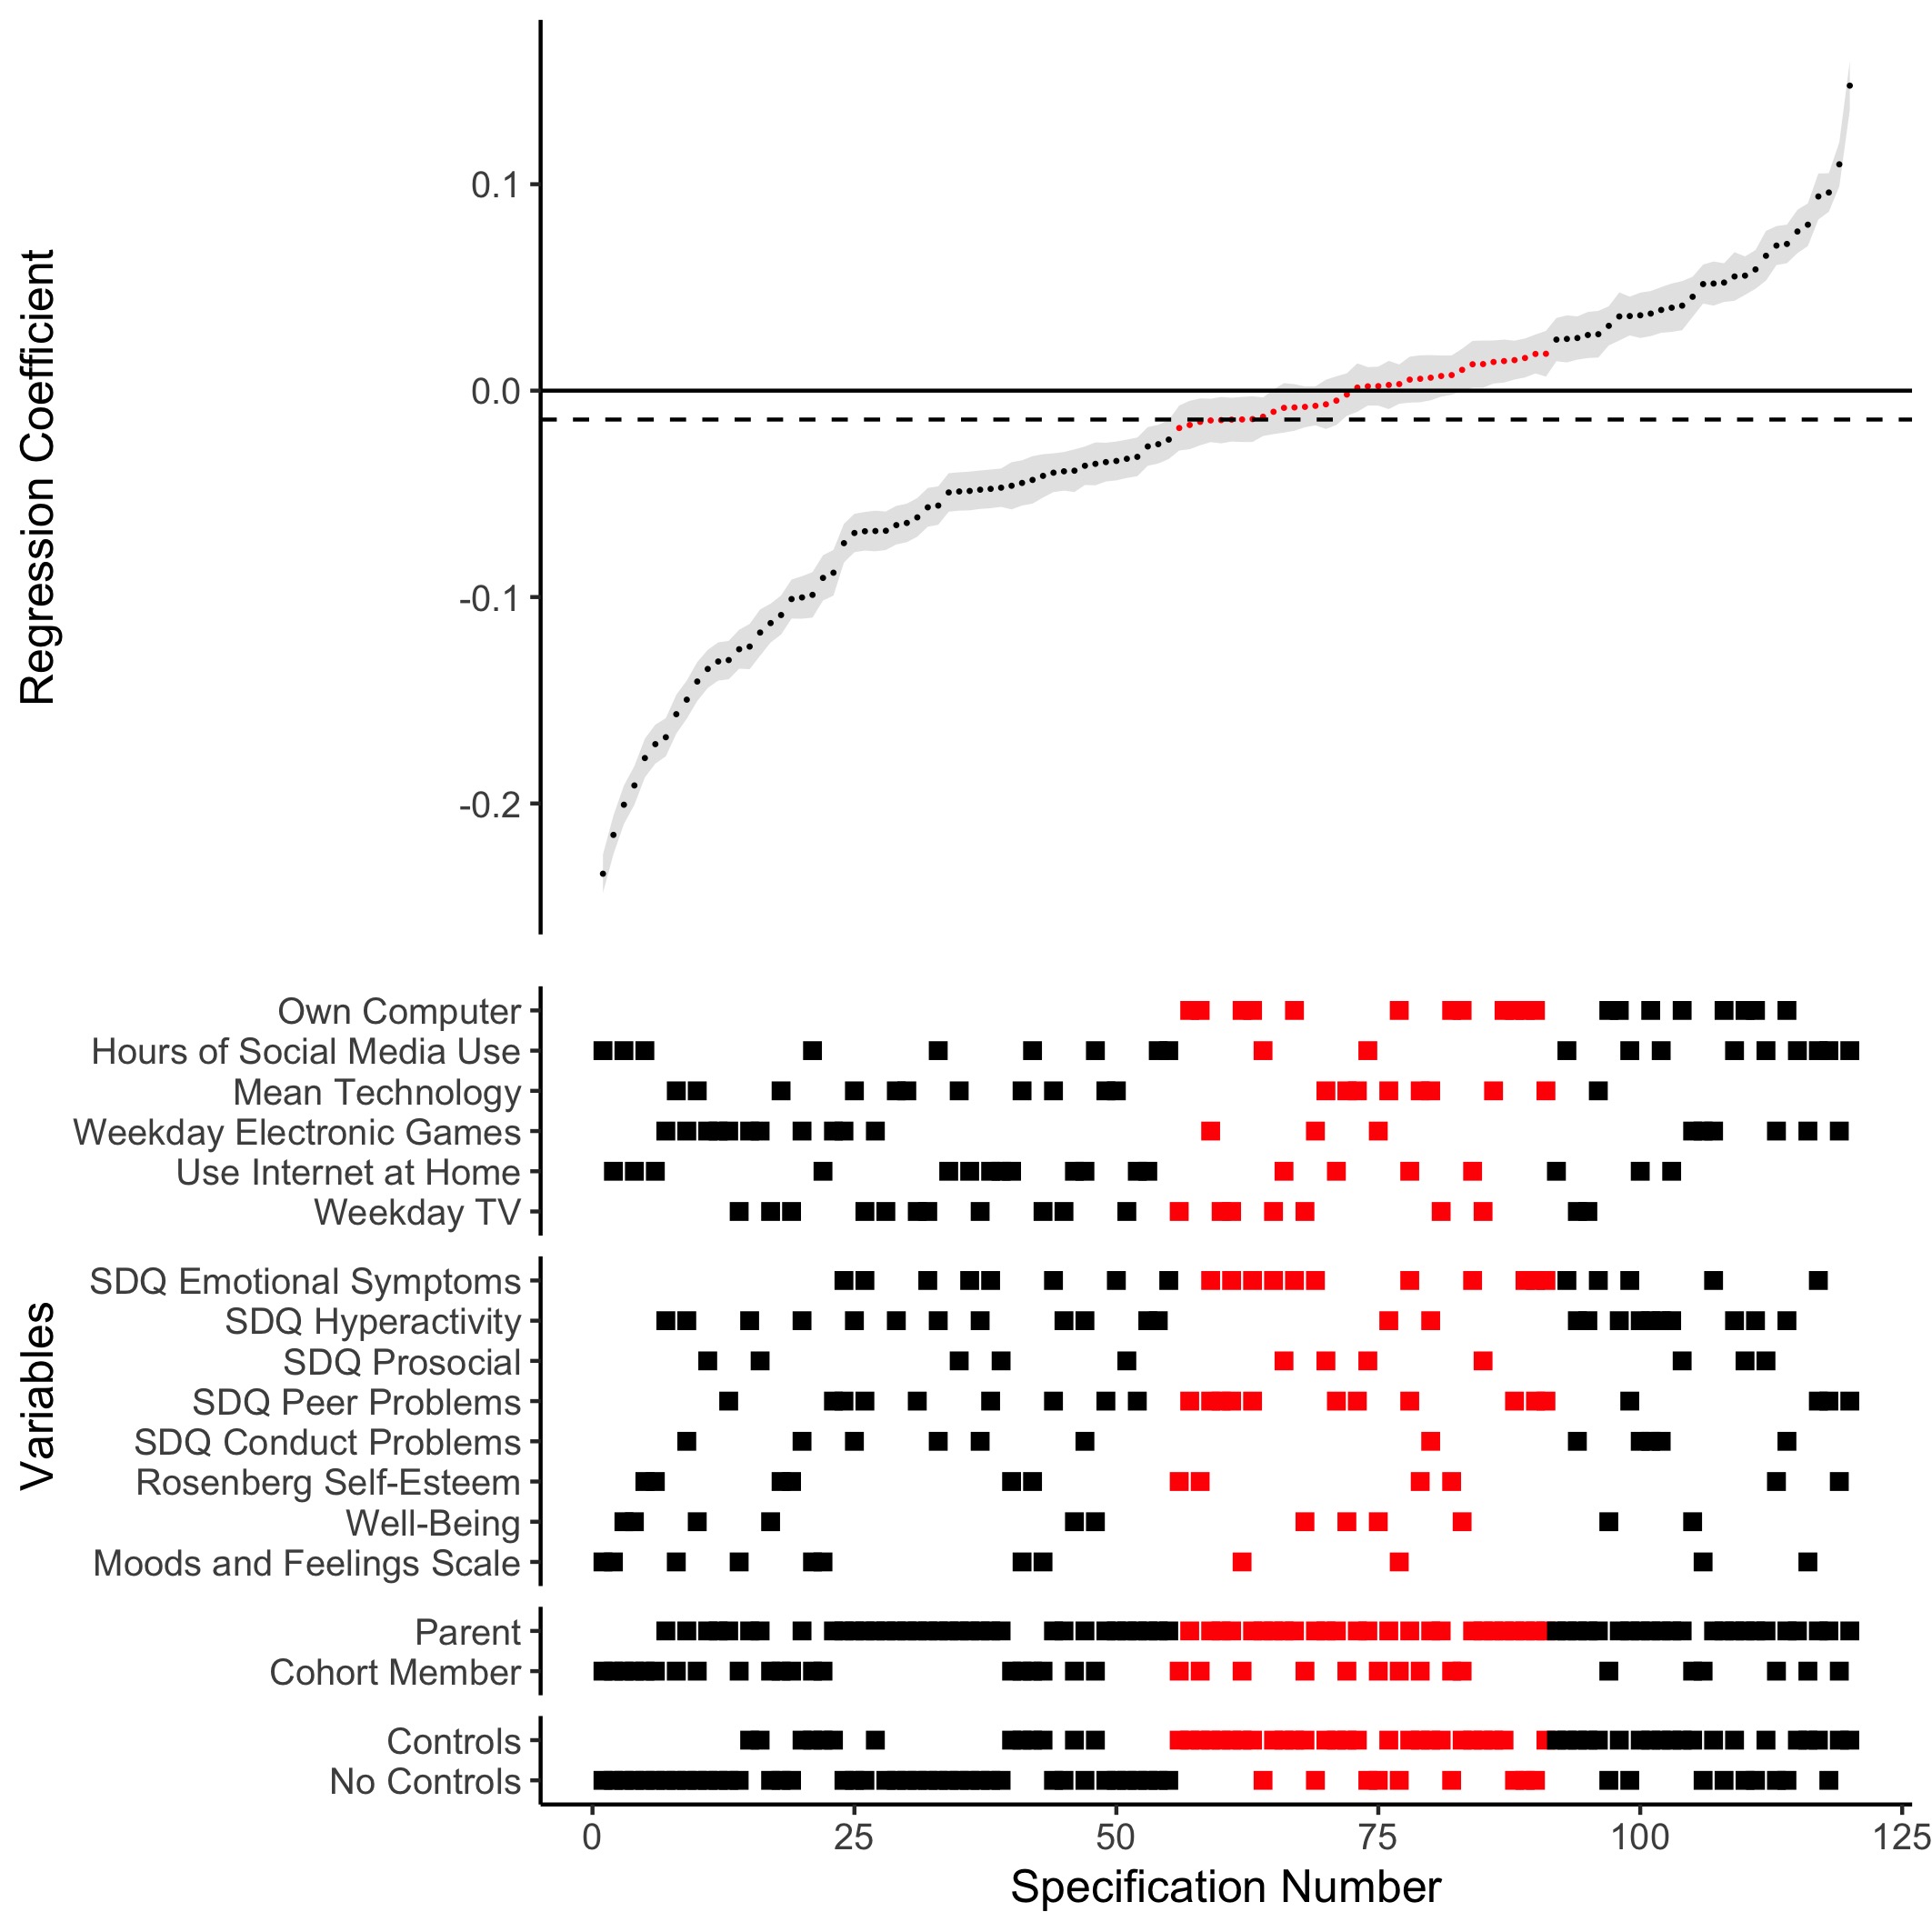
Figure A.1: Specification Curve Analysis of MCS examining net effects across prespecified well-being subscales. The red squares indicate specifications that were non-significant, while the black squares represent specifications that were significant. The error bars represent the Standard Error. The dotted line indicates the median regression coefficient present in the SCA and is included to ease interpretation of the analysis.
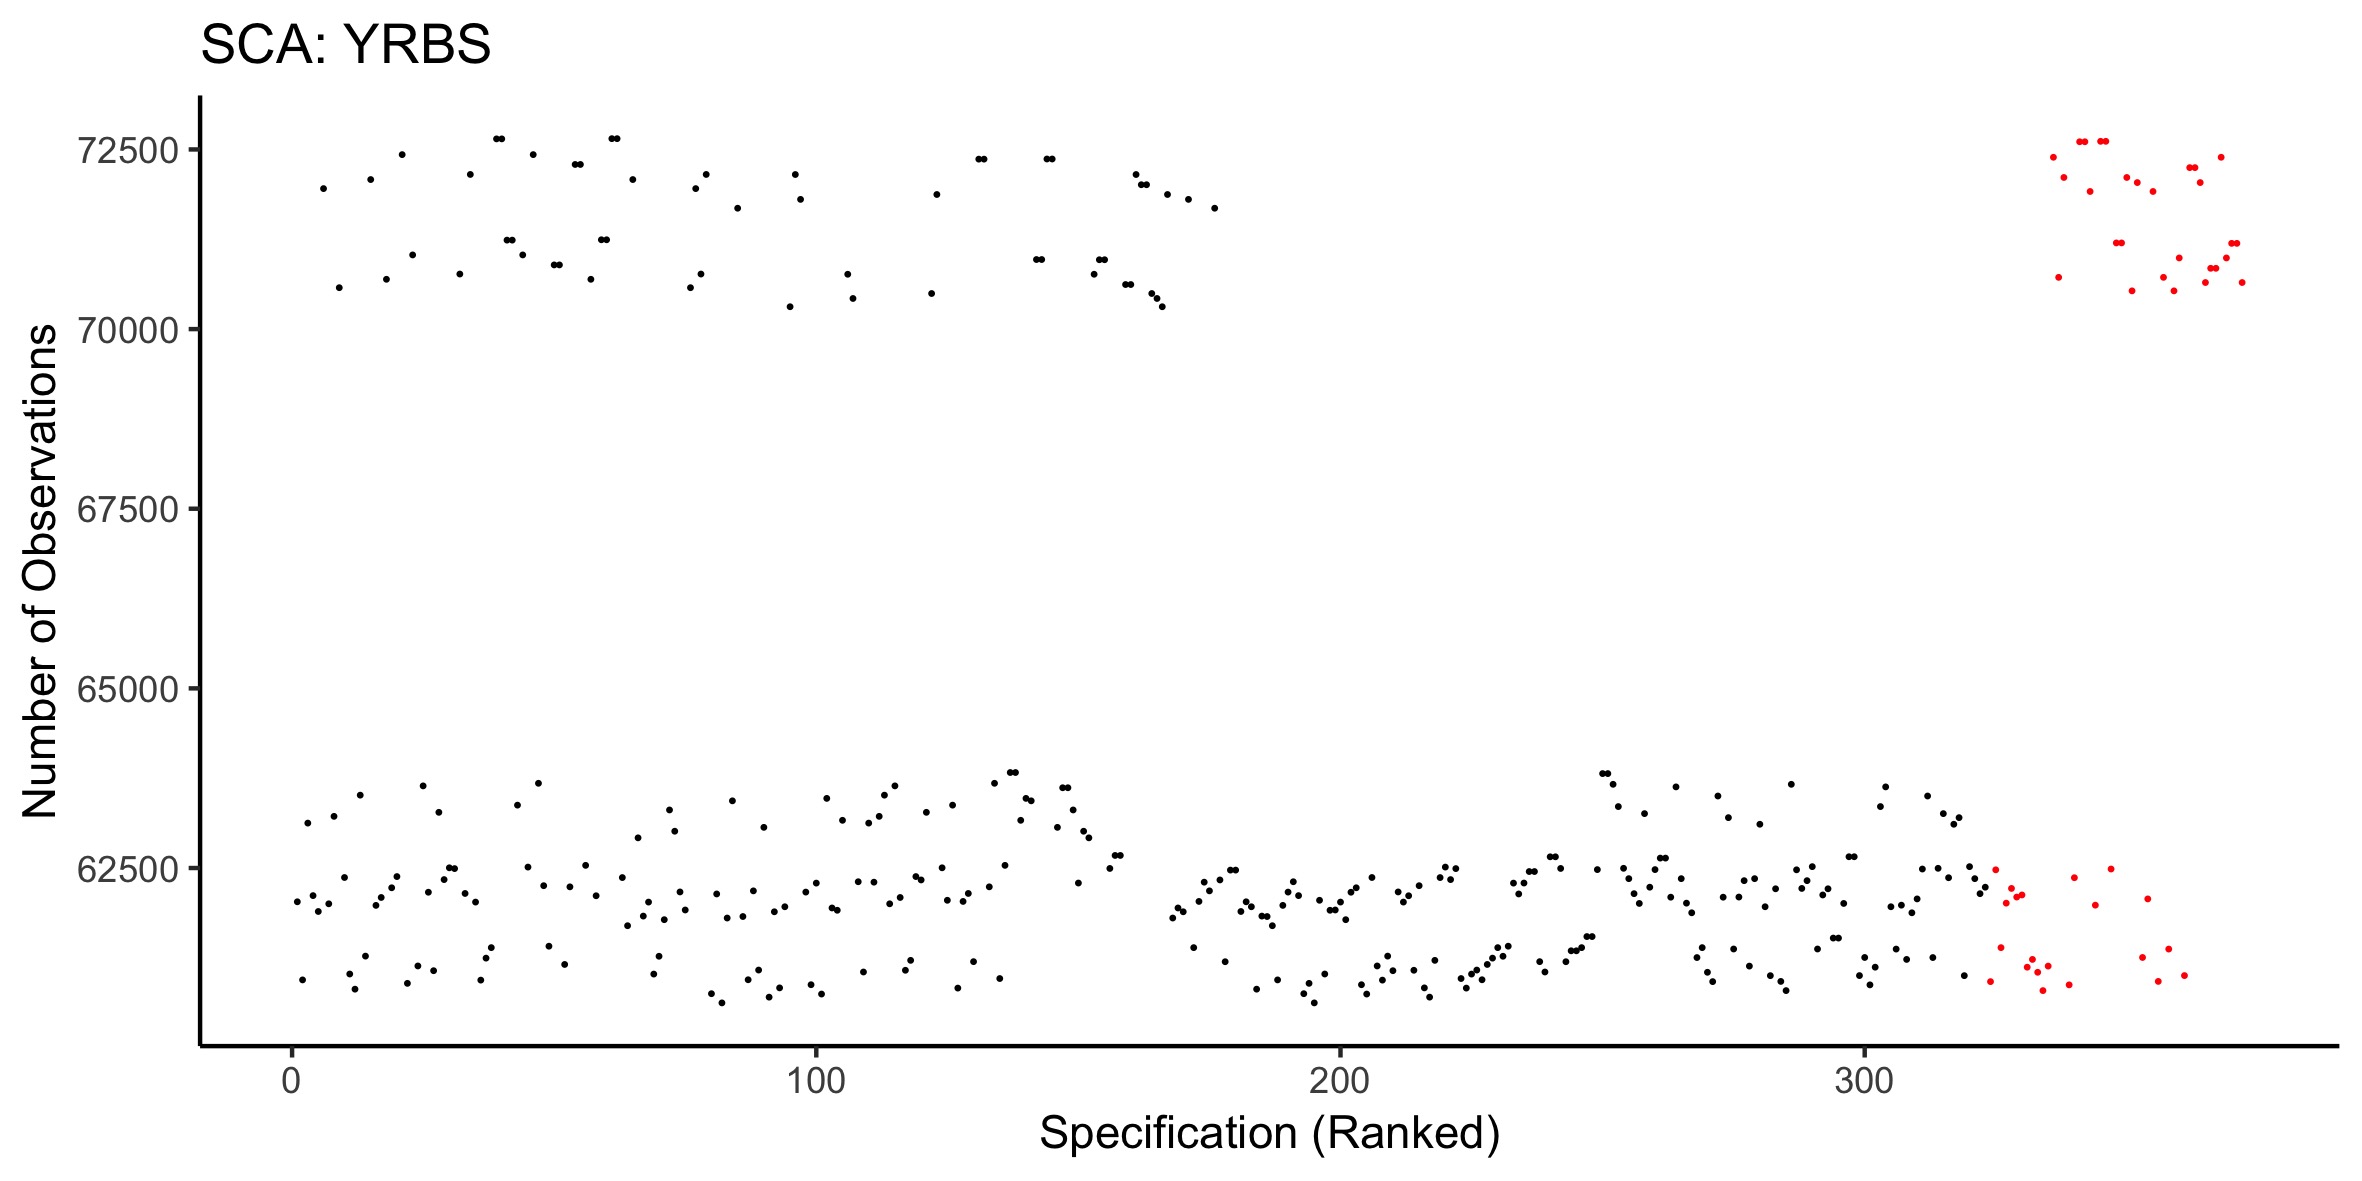
Figure A.2: Number of observations (participants) for each specification analysed in the YRBS SCA. Red dots indicate when the specification was non-significant, while black dots show significant specifications.
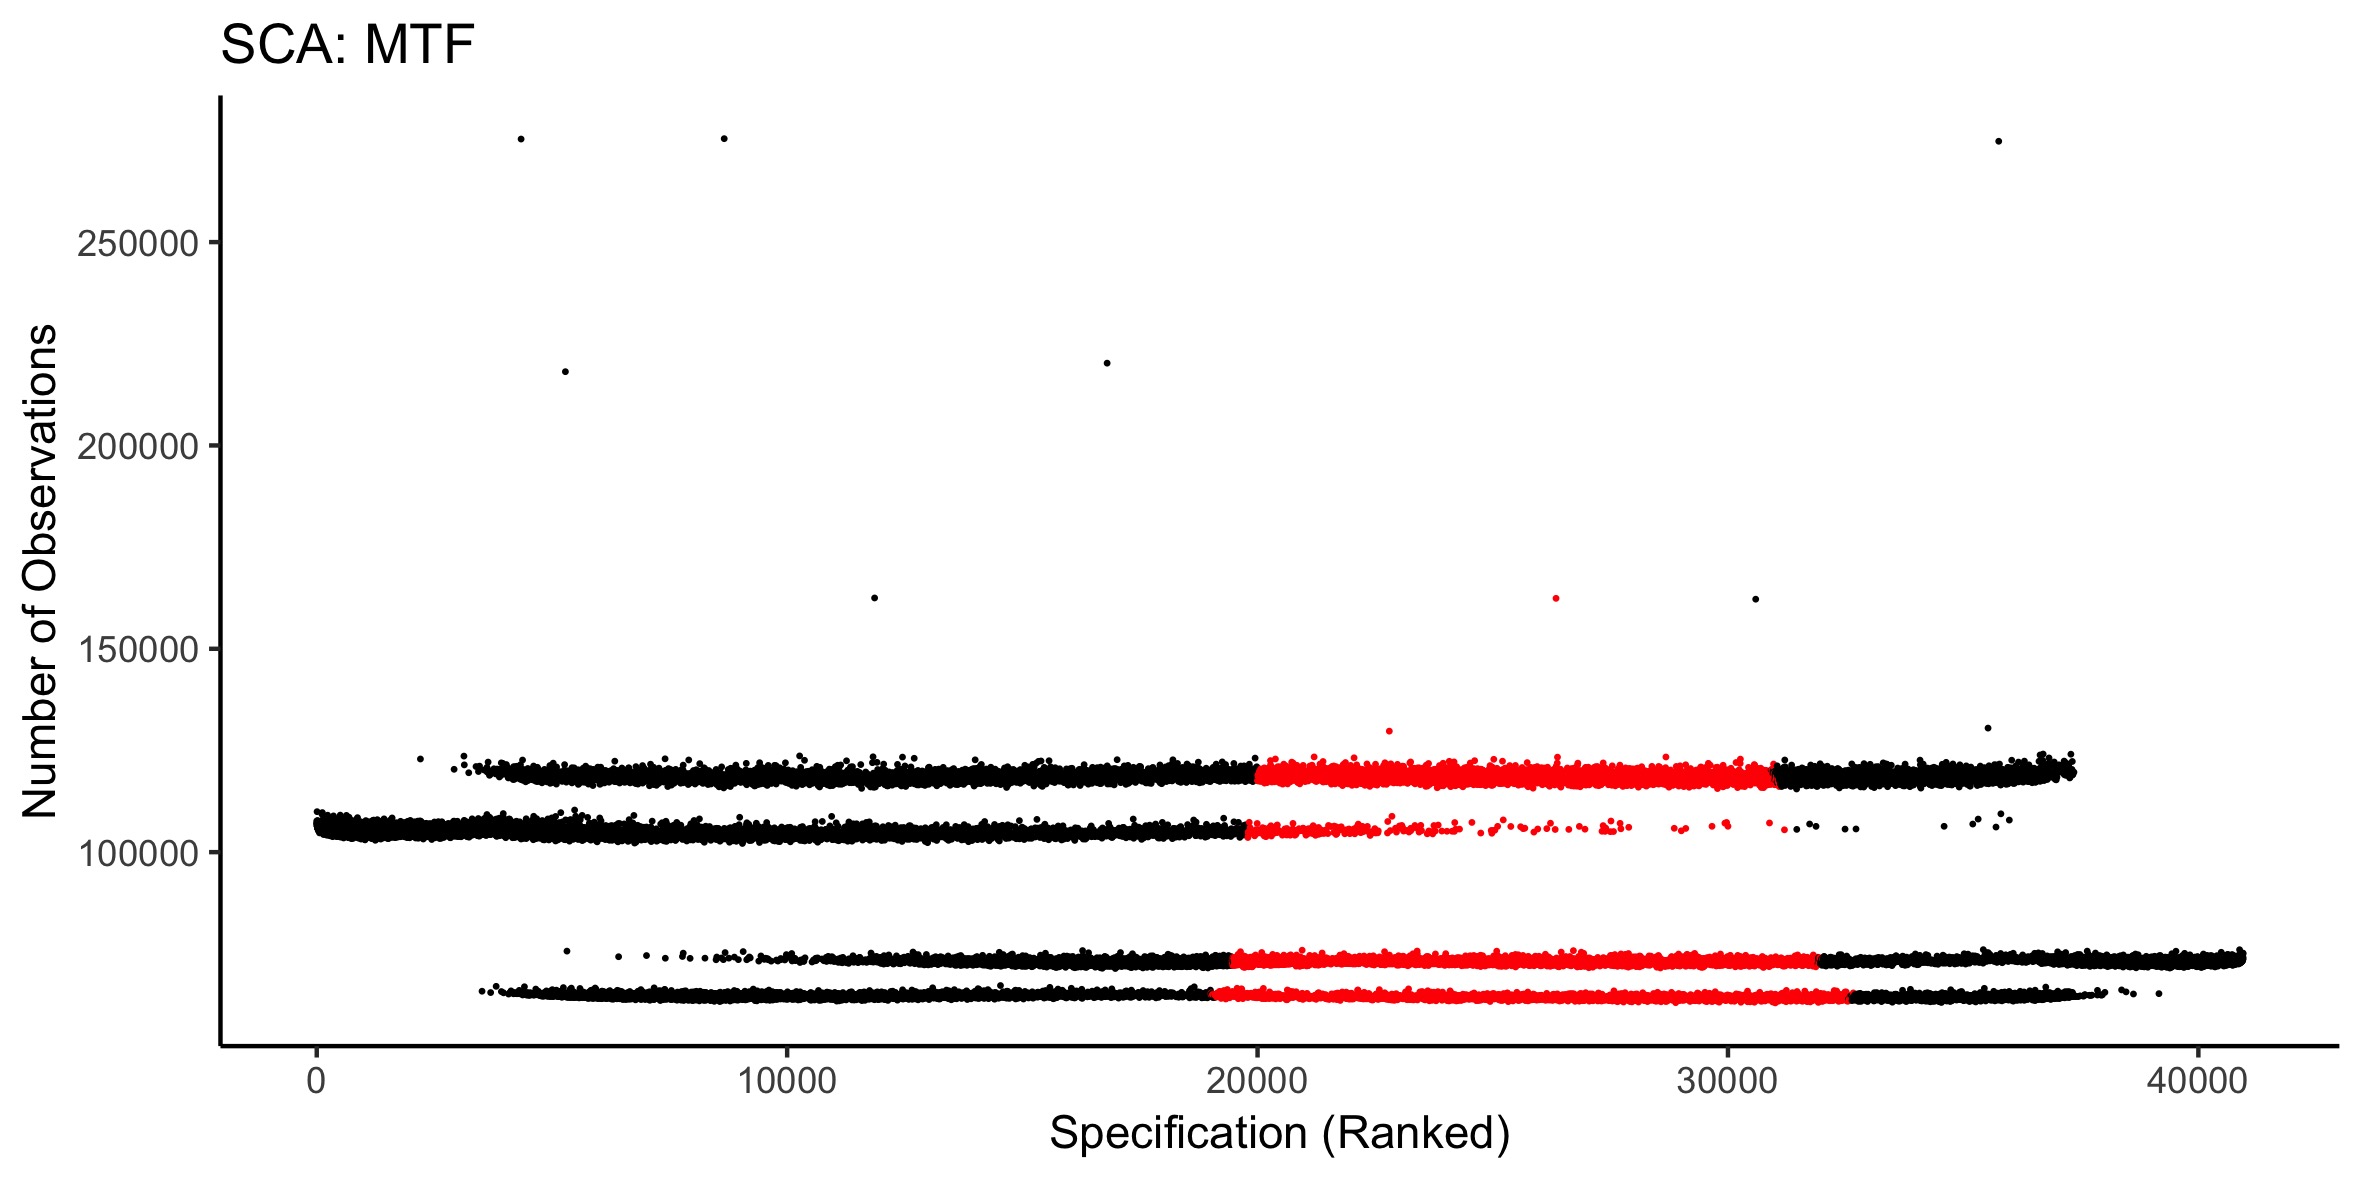
Figure A.3: Number of observations (participants) for each specification analysed in the MTF SCA. Red dots indicate when the specification was non-significant, while black dots show significant specifications.
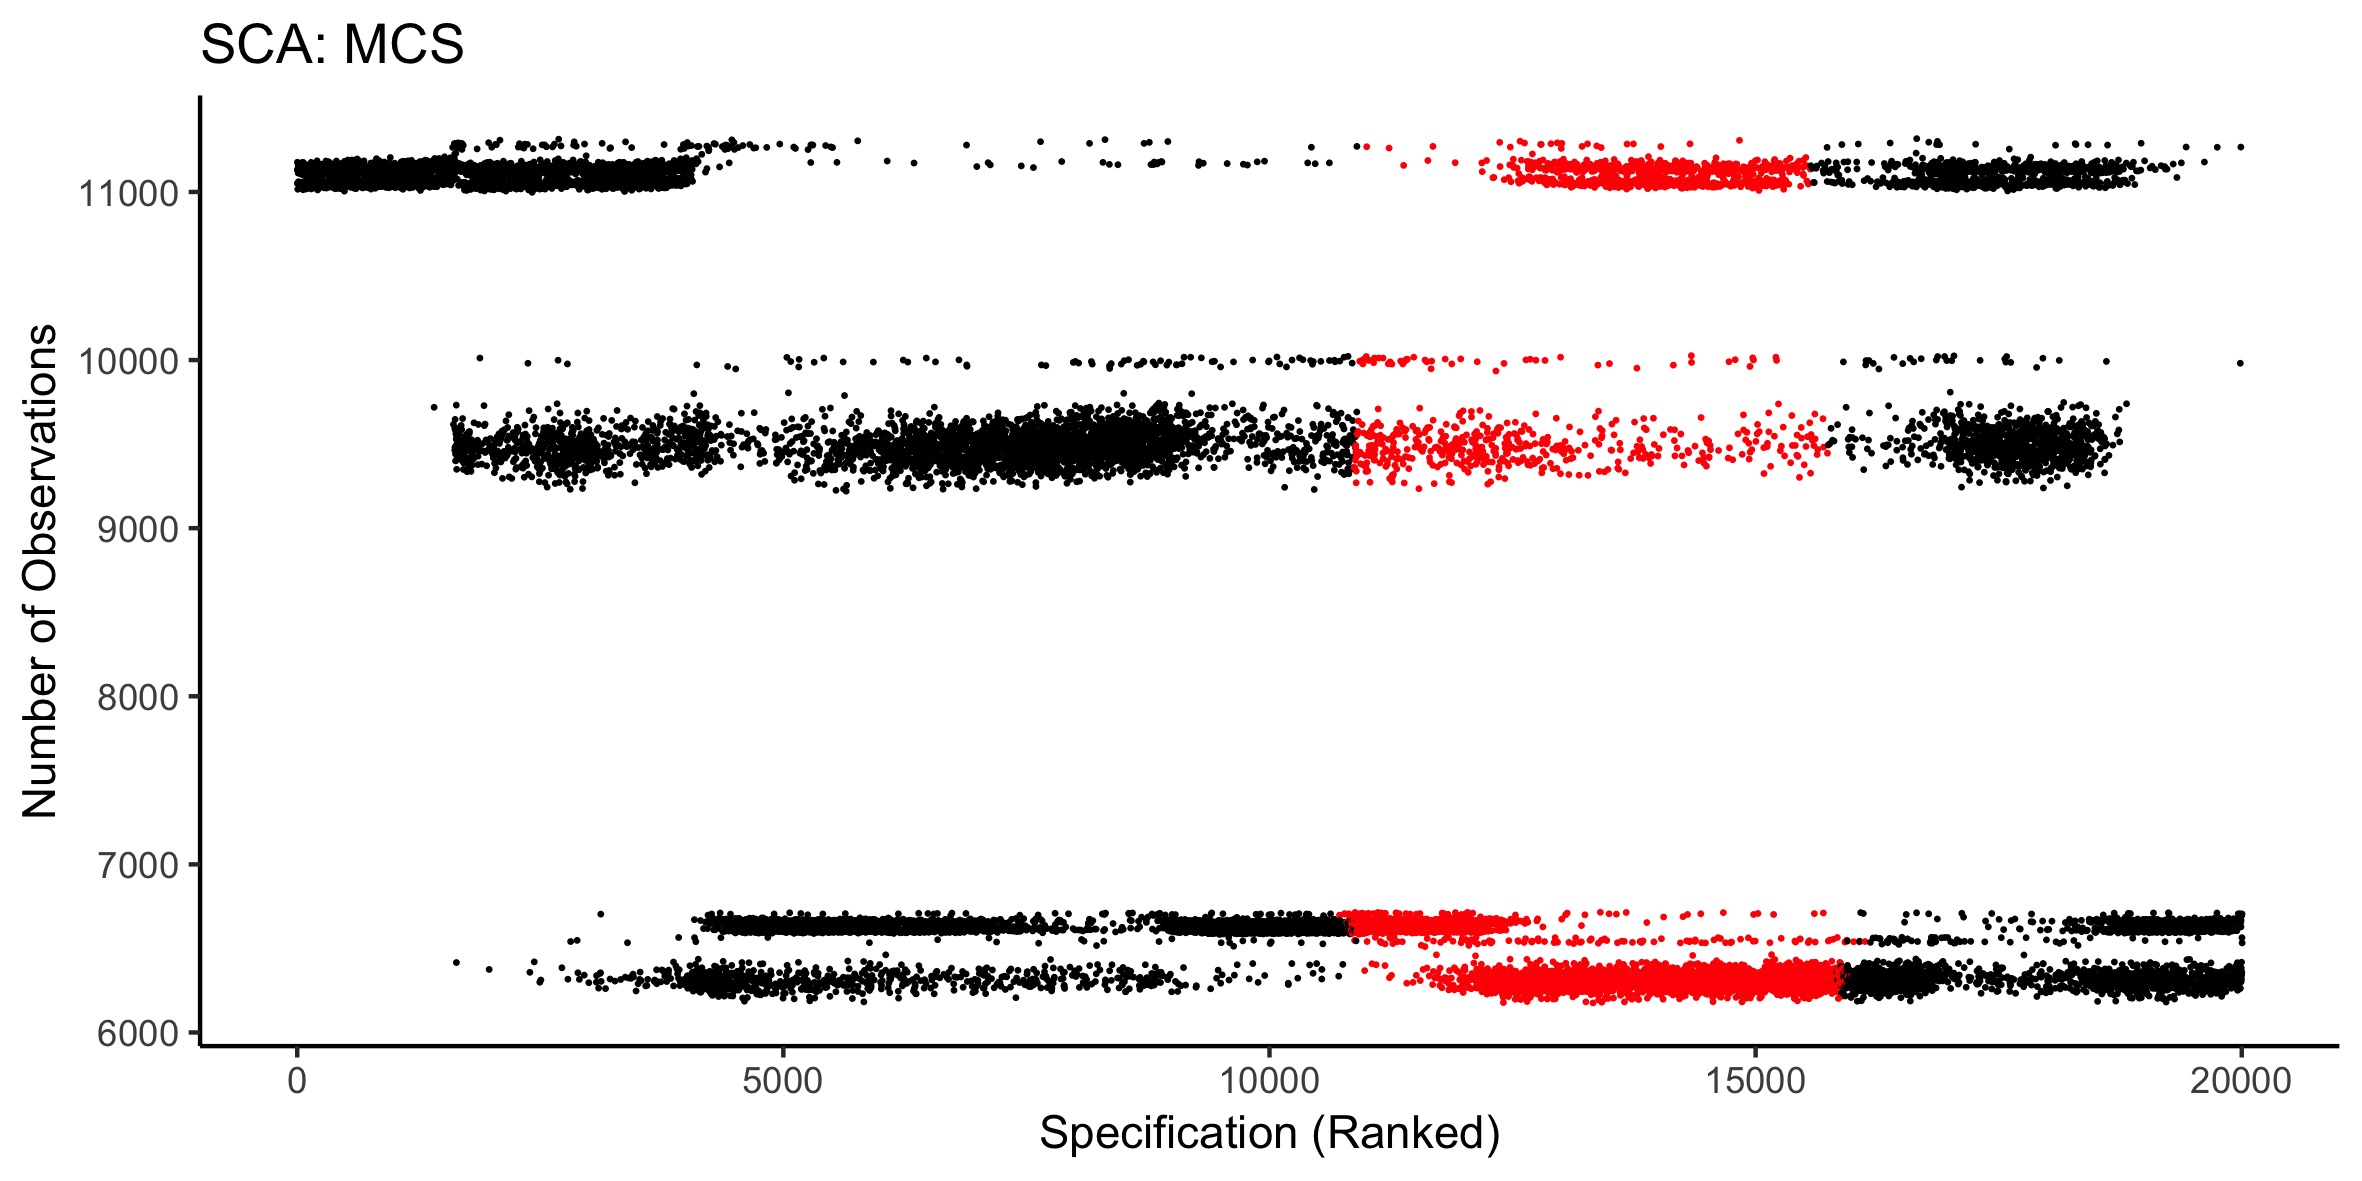
Figure A.4: Number of observations (participants) for each specification analysed in the MCS SCA. Red dots indicate when the specification was non-significant, while black dots show significant specifications.
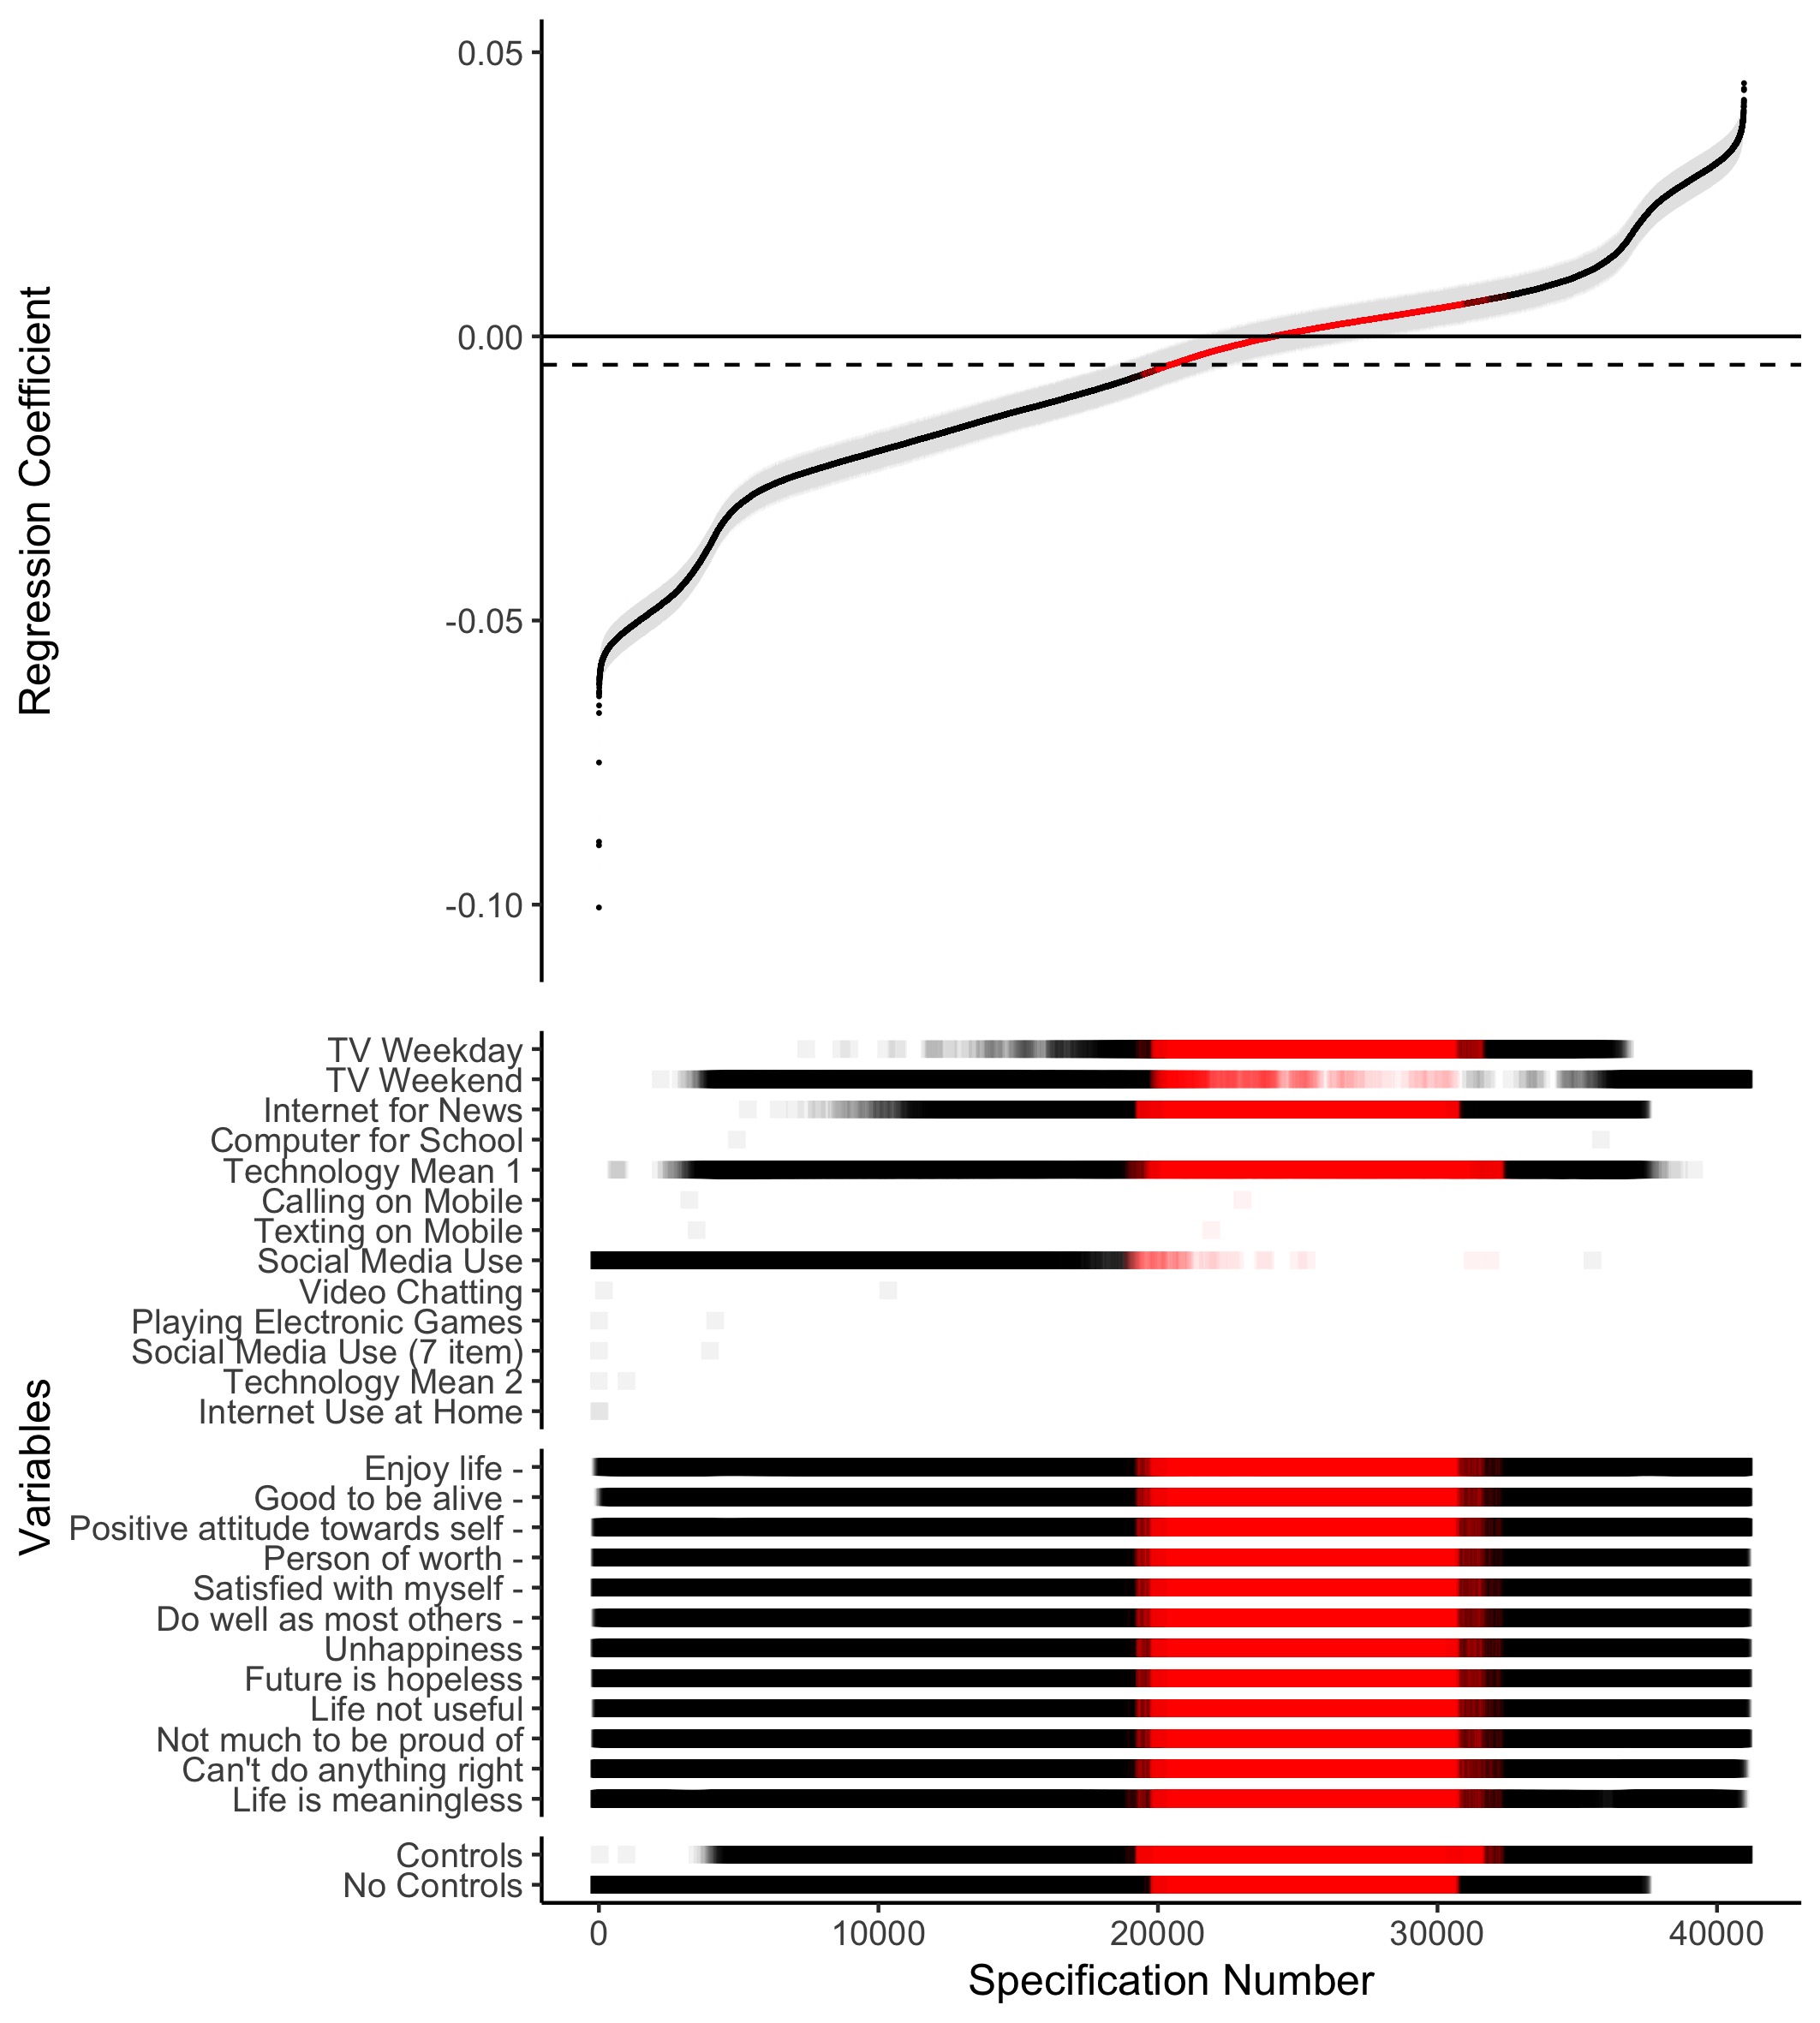
Figure A.5: Specification Curve Analysis of MTF, also including the few specifications that included technology use items that were only asked in conjunction with a one-item happiness question. This subset of questions was excluded from the analyses in the main text to simplify the graphical representations and enhance comprehensibility. The red areas indicate specifications that were non-significant, while the black areas represent specifications that were significant. The error bars show the Standard Error. The dotted line indicates the median Regression Coefficient present in the SCA, and is included to ease interpretation of the analysis.